Muni March Madness in Charts
Considering how dramatic and volatile the month of March was for municipal bonds, it made sense to lift the hood and examine trade data upon which the BondWave Municipal AA QCurve is built. This is useful in explaining some of the shifts observed in the yield curve over last month. As a reminder, the BondWave Municipal AA QCurve is built using only reported trades. As such it is very responsive to intra-day changes in market conditions. In normal times intra-day changes are small. But of course, March was not a normal time.
Trade Volume
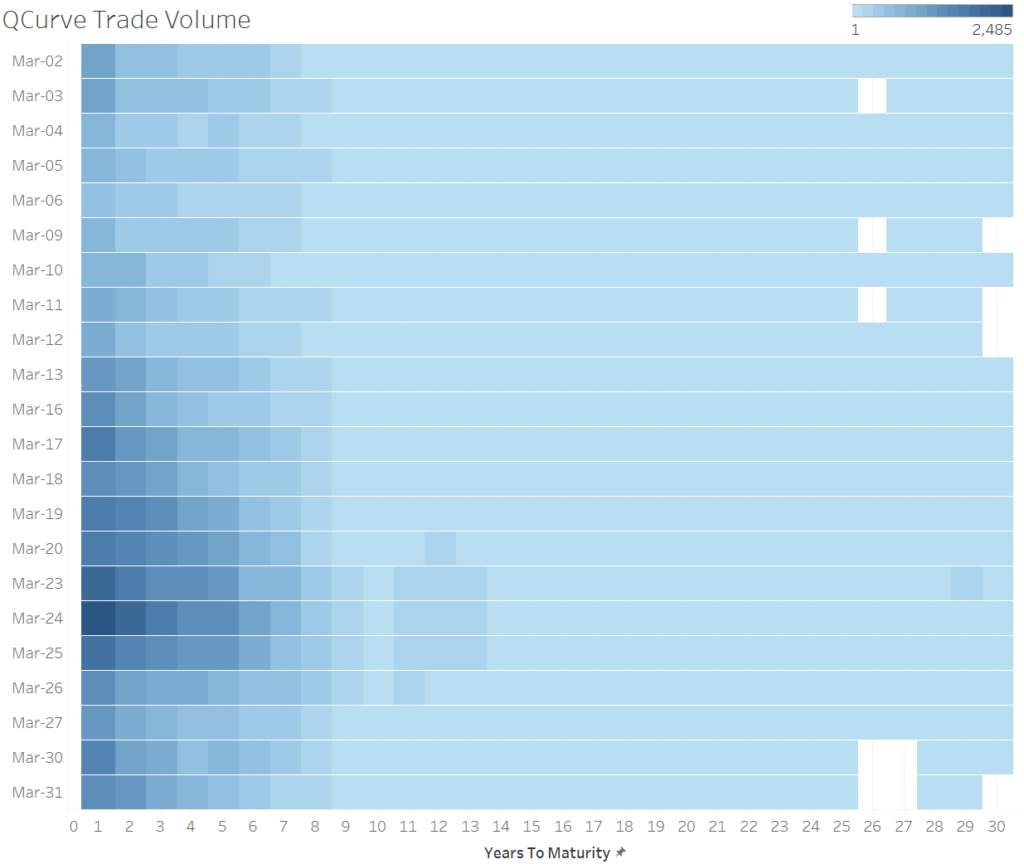
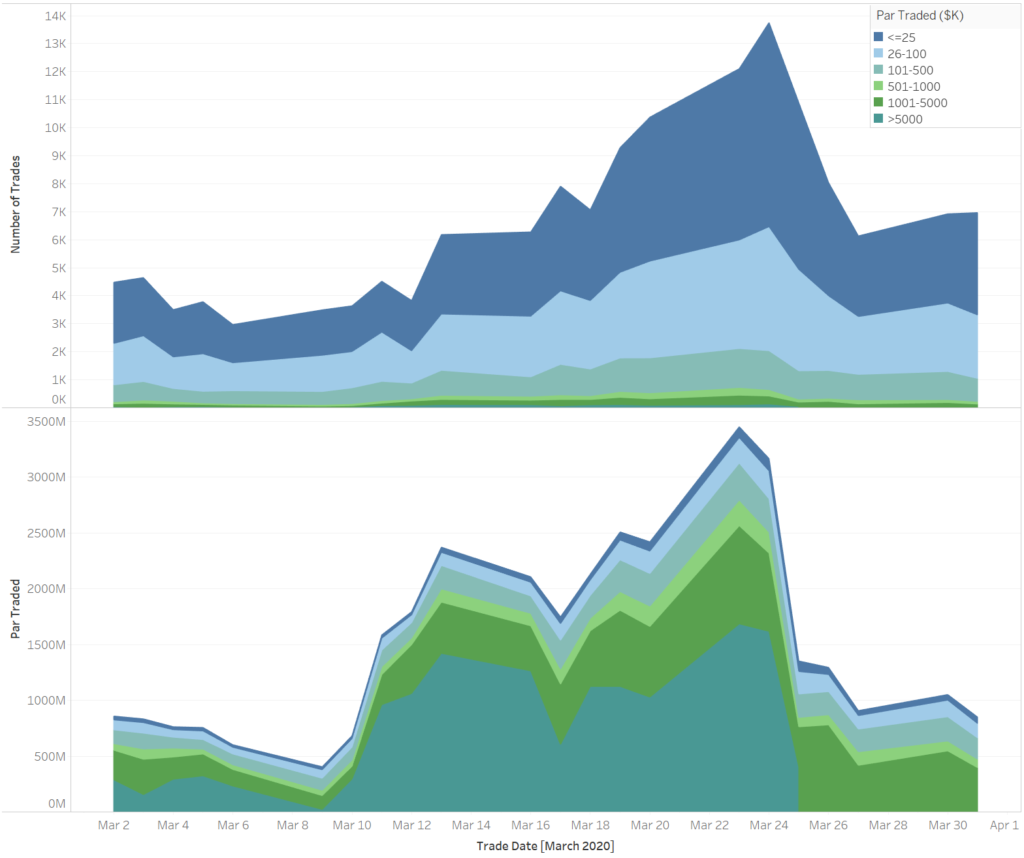
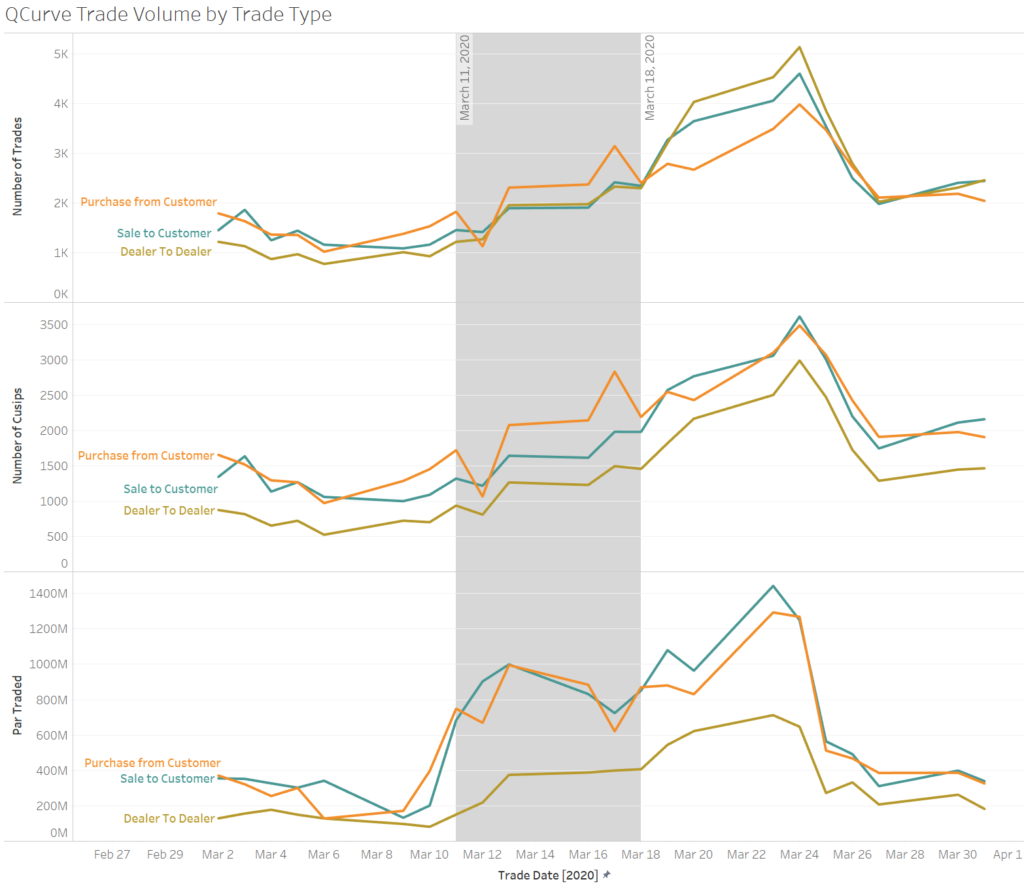
Typically, 14,000 – 16,000 municipal CUSIPs trade daily, only 1.2% of the outstanding municipal universe. This number doubled in March resulting in many more qualifying trades for the AA QCurve. On any given day, anywhere between 2,500- 3,800 trades in 1,300 individual securities typically contribute to the AA QCurve. On March 24th, we saw as many as 13,800 trades in 5,900 individual securities included in the AA QCurve generation process. Unsurprisingly, a bulk of this trade count was in the odd lot space and shorter dated securities as illustrated by the following two graphs, even though round lots constitute the lion’s share of volume. One thing to remember while looking at the second Trade Volume graph below is that MSRB disseminates true trade sizes for investment grade bond trades that are greater than $5 million, and high yield bond trades that are greater than $1 million, after a week.
QCurve Yields
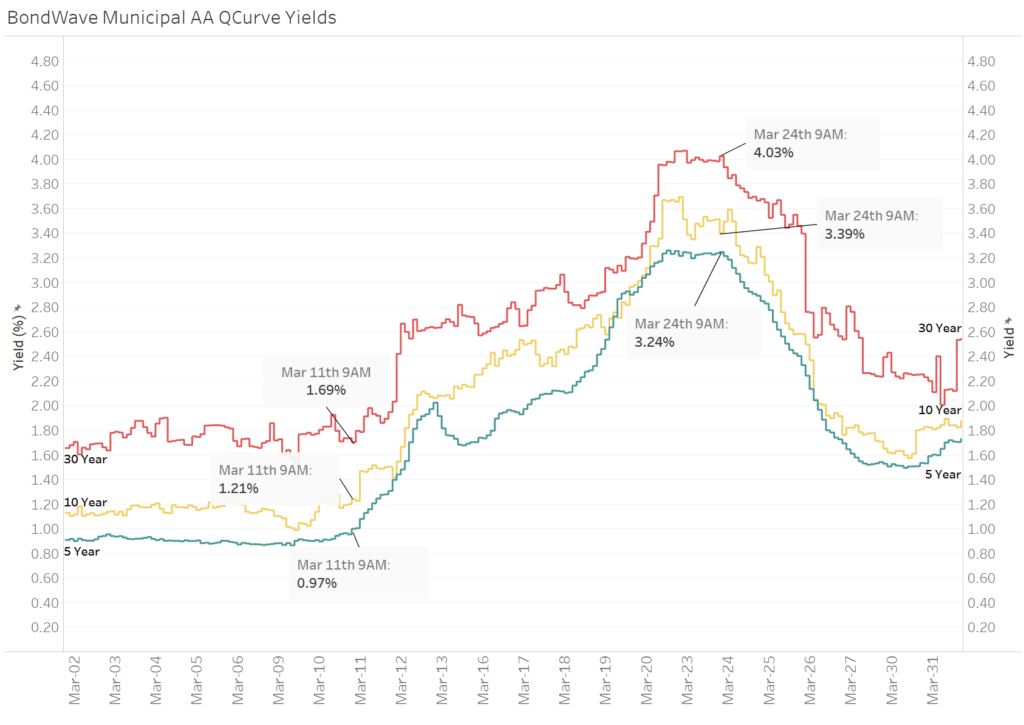
In the middle of March, over a span of 10 trading days, the 10-year point on the BondWave Municipal AA QCurve increased by 218 bps – from 1.21% on the morning of March 11th to 3.39% on the morning of March 24th. It was the largest increase seen in that duration since the inception of QCurves in 2016. At the end of the day on March 31st, the 10-year yield was 1.88%, more than halfway back to its beginning of month levels. A graph of hourly yield changes (below) clearly shows that daily shifts in yield curves, although large, took place gradually throughout the day. This is easiest to see in the green 5-year line below where the hourly changes are relatively small but constant.
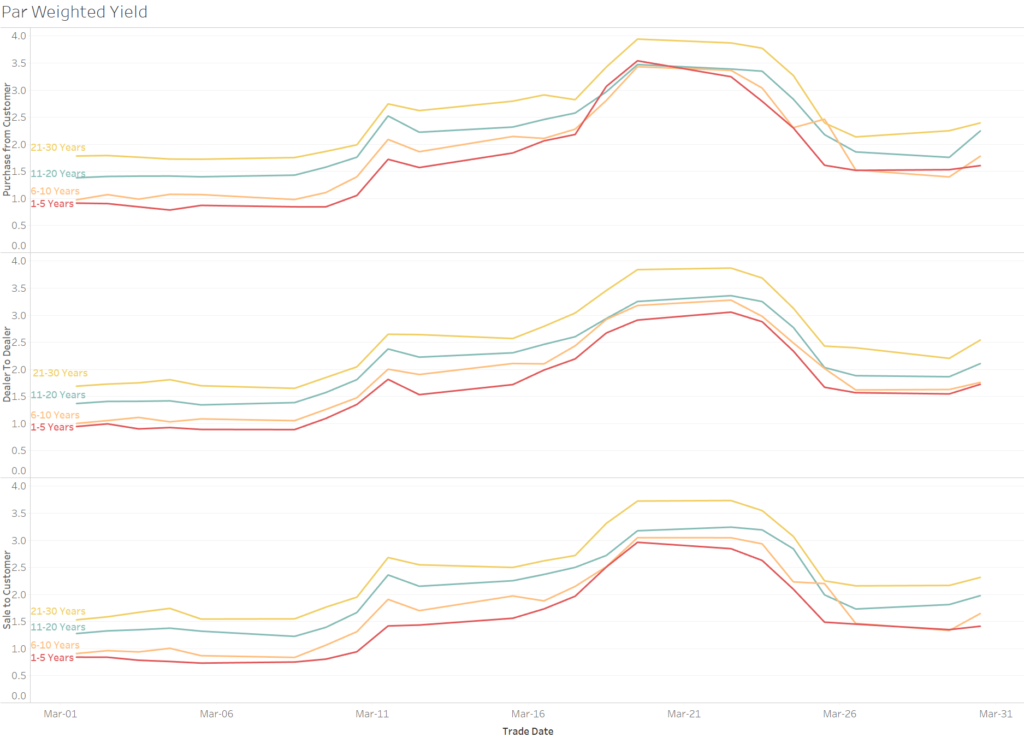
The earlier part of this yield-rise phase between March 11th and March 18th was driven by a corresponding rise in customer sales of bonds (Trade Type: Purchase from Customer), and later by all types of trading activity.
This phenomenon is especially pronounced in the short end of the curve as shown in the graph below. We can see the 1-5 Year Par Weighted Yields for Purchase from Customer trades (red line in the top graph) beginning to rise much faster than the rest of the trade types and maturities.