Trade Insights – Volume 20
As 5-year and 10-year U.S. Treasury rates rapidly approach 5% on the heels of 11 Fed Funds rate hikes in a 17-month span, the municipal yield curve has been significantly impacted as well. In this piece we will highlight how municipal yields, as measured by the BondWave Municipal AA QCurve TM, have moved in tandem with the U.S. Treasury yield curve and the rising rate environment of 2022-23.
The effect of the Federal Reserve’s tightening policy has differed across the term structure of municipal bond interest rates (Chart 1). As the general level of rates has increased, the difference between rates at the short end of the curve and rates at the long end of the curve has shrunk. And in some cases, the curve has even inverted.
The first signs of this municipal yield curve flattening emerged well before the Federal Reserve started raising rates in March 2022. At the beginning of 2022, the municipal yield curve flattened primarily in the 5- to 10-year portion. The 1- to 5-year portion of the curve followed suit within the next few months, by which time the Federal Reserve had already raised the Fed Funds rate four times.
Chart 1: BondWave Municipal AA QCurve 1-, 5-, and 10-Year Yields Time Series
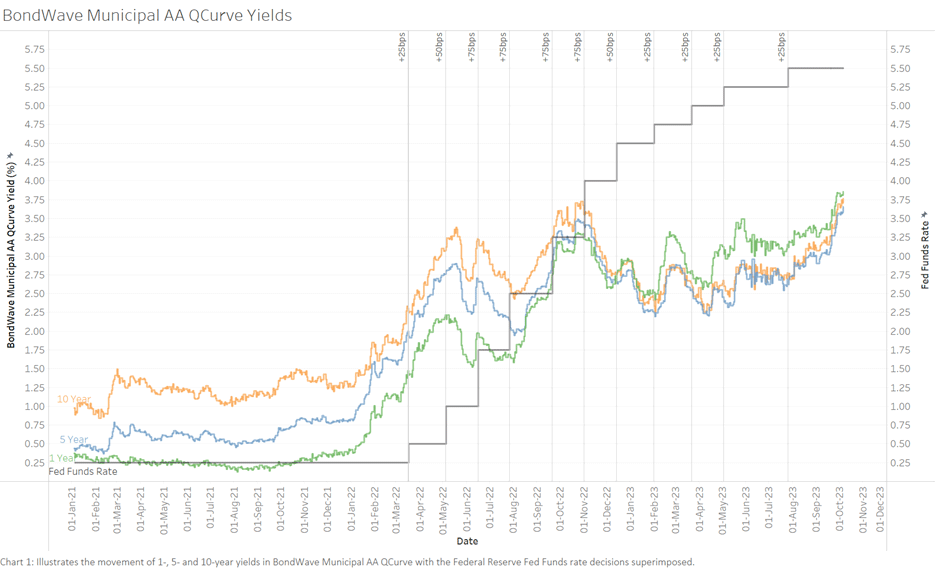
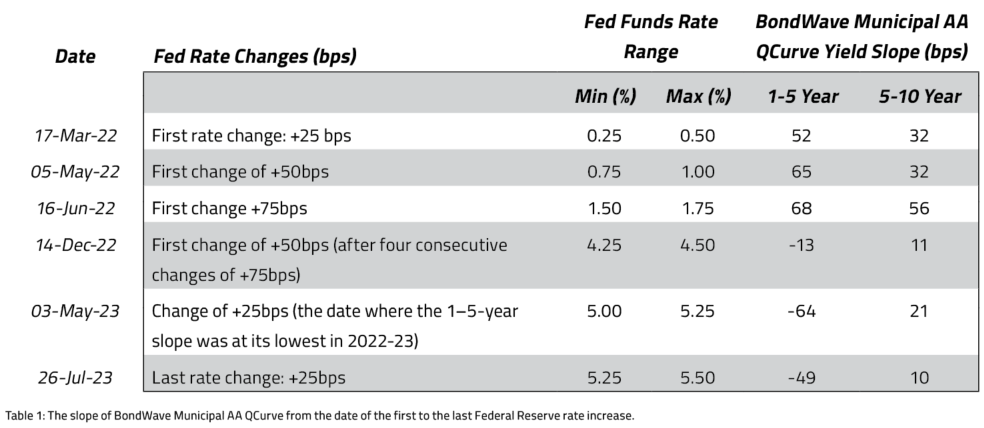
Ultimately, the municipal yield curve inverted December 12th, 2022. At this point the 1-year yield surpassed the 5-year yield and started to inch closer to the 10-year yield. The 10-year yield has since dipped below the 1-year yield, and the pattern has persisted well into 2023. The 1–5-year section of BondWave Municipal AA QCurve remained inverted at -49 bps as of July 26th, 2023 – the date of the last Fed Funds rate increase (Table 1).
Table 1: Fed Funds Rate Changes 2022 – 2023
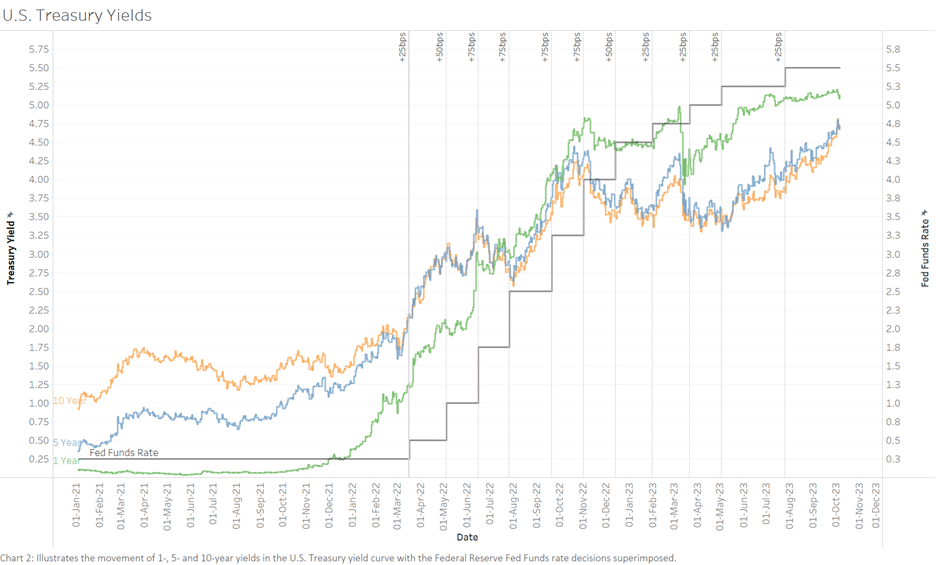
U.S. Treasury yields have followed a similar trend but in a more pronounced manner due to their relationship with the Fed Funds rate (Chart 2).
Chart 2: U.S. Treasury 1-, 5-, and 10-Year Yields Time Series
The peculiarity of this rate environment is most obvious in the Muni/Treasury ratio. Short-term municipal bonds were considerably cheaper than short-term U.S. Treasuries (Muni/Treasury ratio greater than 100%) well past the market dislocations of 2020 (Chart 3). From a 2021 Muni/Treasury ratio high of 700% up to the first Fed Funds rate increase in March 2022, this began to change as the increase in short-term U.S. Treasury yields began to outpace the change in short-term municipal yields.
The 5- and 10-year portions of the curve reflected more normal Muni/Treasury ratios much earlier. By the beginning of 2021, the 5- and 10-year Muni/Treasury ratios had mostly returned to their normal levels (below 100%).
Chart 3: Muni/Treasury Ratio at 1-, 5-, and 10-Year Time Series, 2020 to Present
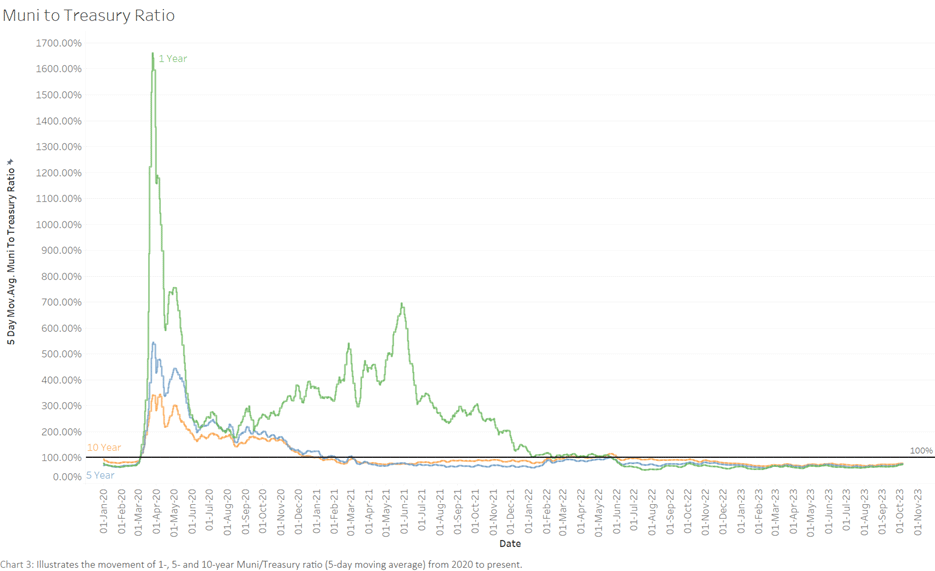
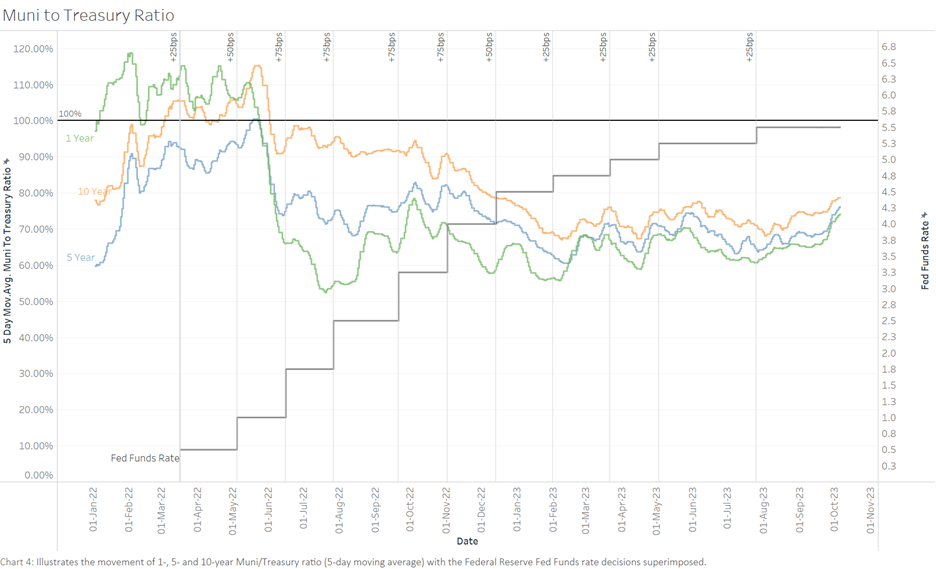
The Federal Reserve’s rate changes finally brought the 1-year Muni/Treasury ratio below 100% in May 2022. In the early days of tightening monetary policy, short-term municipal yields took a hit, making municipal bonds more expensive relative to comparable U.S. Treasuries, as reflected in the 1-year Muni/Treasury ratio. By July 2022 the 1-year Muni/Treasury ratio dipped as low as 51% (Chart 4). After nearly 3 years of extreme volatility the 1-, 5-, and 10-year Muni/Treasury ratios have settled into pre-pandemic levels near 70%.
Chart 4: Muni/Treasury Ratio at 1-, 5-, and 10-Year Time Series, 2022 to Present