Trade Insights – Volume 19
On May 15, 2023 FINRA began disseminating a portfolio trading flag for corporate bond trades that satisfied three criteria: they were executed between only two parties, involving a basket of corporate bonds of at least ten unique issues, for a single agreed price for the entire basket. With a small data size BondWave is taking a preliminary look at portfolio trading through the lens of our Transaction Quality Analysis (TQA) service. Transaction quality analysis takes transaction cost analysis to its logical next step by placing transaction costs in context through comparisons to peer cost benchmarks. In this way we can determine if the cost paid for a transaction is in line with industry norms. BondWave plans to update and extend this analysis as the number of disseminated portfolio trades grows.
Portfolio trading promises multiple benefits. Among them are cost effectiveness, enhanced liquidity, and reduced execution timelines leading to reduced market risk. As a result, corporate bond portfolio trading has grown to represent 4.6% of customer trades and 7.6% of customer par value traded between May 15, 2023, and June 30, 2023.
In this paper we will perform a partial examination of the cost effectiveness of portfolio trades. This initial examination will measure execution quality at the individual trade level and for portfolio trades taken as a whole. By examining the individual trades as a group, we miss out on the liquidity subsidy effects that are one of the primary arguments in favor of portfolio trading. In a follow up paper, we will look at trades grouped into their respective portfolios to measure the potential liquidity subsidies that portfolio trading can provide.
Data
There appear to be two primary procedures for printing portfolio trades. The first procedure involves two prints for a single trade: a dealer-to-dealer leg and a dealer-to-customer leg with both legs at the same price. This makes the trades look like costless riskless principal trades even though portfolio trading presumably involves both the commitment of capital and compensation for that commitment. To avoid overstating the size of portfolio trading and miscalculating the cost, we exclude the dealer-to-dealer leg in this analysis and focus solely on the dealer-to-customer leg. The second procedure involves a single dealer-to-customer leg per trade.
There also appears to be a use case for portfolio trades that does not involve arm’s length negotiated prices: customer crossing. These trades involve identical dealer-to-customer trades on both sides of the market at the same price. While it is possible that these are not cross trades, the lack of revealed dealer compensation in these trades makes them of a different type than the other trades in our sample. For this reason, we exclude these trades in this analysis.
From May 15, 2023, through June 30, 2023, there were 82,652 customer trades marked with the portfolio trade flag. Of those, 73,595 were for regular settlement and were not part of a portfolio cross trade. These are the trades we will examine.
Portfolio Trading Cost
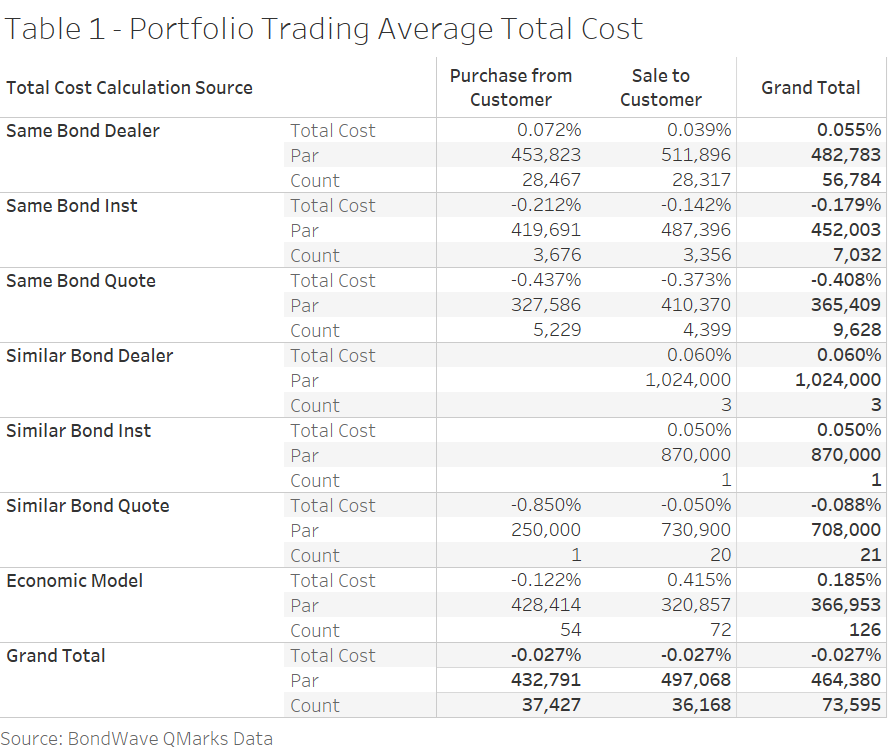
For all 73,595 qualifying customer portfolio trades BondWave has calculated the average total cost at -2.7 basis points, or 2.7 basis points of price improvement. However, this is an insufficient level of detail to perform a meaningful analysis. We use contemporaneous market observations to determine the cost of a trade, and fixed income data is sparse and of variable quality. When calculating trade cost, the type of contemporaneous market observation used matters. A contemporaneous trade has greater value than a contemporaneous quote, and a contemporaneous trade without mark-up (i.e., a dealer-to-dealer trade) has greater value than a contemporaneous trade with mark-up (i.e., a dealer-to-customer trade).
Table 1 shows the breakdown of total cost by the data source used to perform the total cost calculation. The preferred method of performing a cost calculation is to compare a client execution to contemporaneous executions in the dealer-to-dealer market. Absent any trades in the dealer-to-dealer market, we compare the execution to any contemporaneous institutional sized client executions. In this way we work our way down the prevailing market price waterfall to calculate the cost of a trade based on the highest point in the waterfall where we find data.
For the 56,784 instances of portfolio trades (77.2%) where one or more contemporaneous dealer-to-dealer trades were used to perform the total cost calculation, the average total cost was 5.5 basis points (7.2 basis points for purchases from customers, 3.9 basis points for sales to customers).
Portfolio Trading Transaction Quality
While measuring transaction cost is a necessary first step to determine the effectiveness of portfolio trading, it is not sufficient. We must place these transaction costs into context. To do this, we use BondWave’s Transaction Quality Analysis service. TQA compares the total cost of each individual trade to a peer benchmark that relates to that trade. By calculating the cost of a trade relative to its peers we can begin to talk about the quality of the execution, not just the cost.
In the equity market, transaction cost peer benchmarks have been defined by investor types (pension funds, institutional money managers, retail investors, et al). BondWave takes advantage of a key structural element of the fixed income market, disseminated trades are likely to also be parent trades, to define peer benchmarks based on a combination of bond features and trade characteristics. For example, a customer buy in a BBB-rated corporate bond that matures in 22 years, with a par size of 500,000, might be done as a principal trade by the broker. This trade can then be compared to all other trades with similar characteristics in a contemporaneous time frame regardless of the nature of the investor doing the trade.
By comparing transaction costs to a peer benchmark for transaction costs we derive a transaction quality metric. A positive value for transaction quality represents lower trading costs than the peer average. Table 2 shows the average total cost, average benchmark cost, and average transaction quality for portfolio trades.
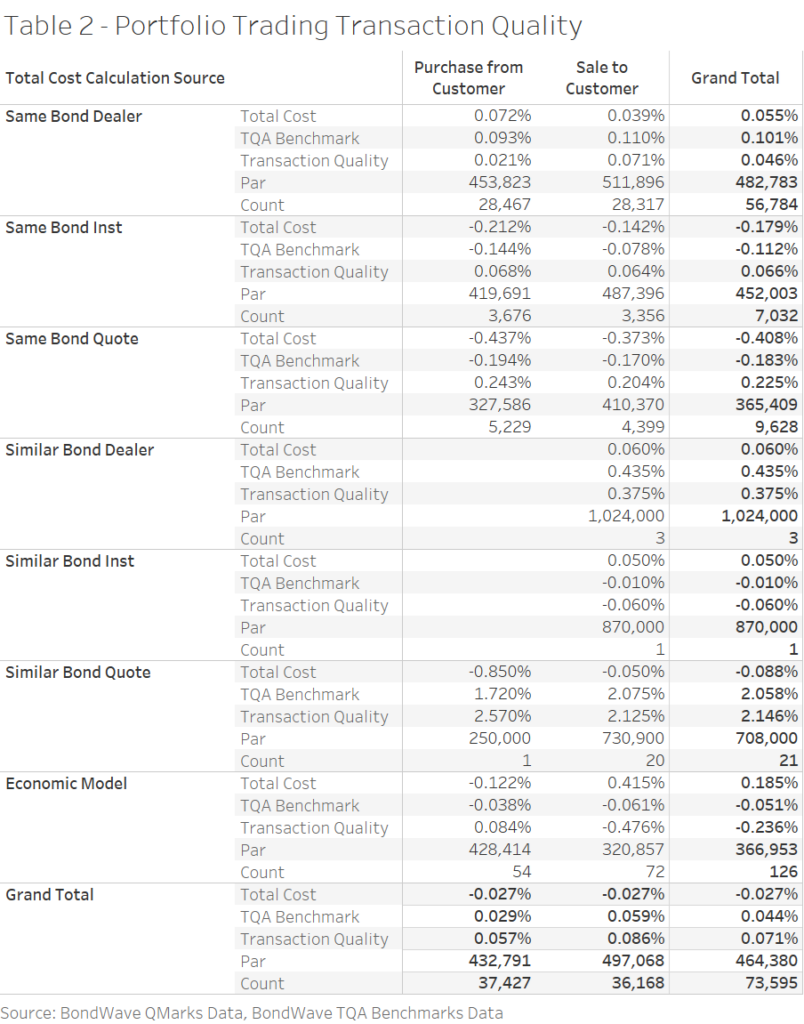
Broadly speaking, the average total cost of a portfolio trade where there are other dealer trades to compare to (56,784 of 73,595 trades in our sample) is 5.5 basis points. This is an improvement of 4.6 basis points over the peer average cost of 10.1 basis points.
Distribution and Outliers
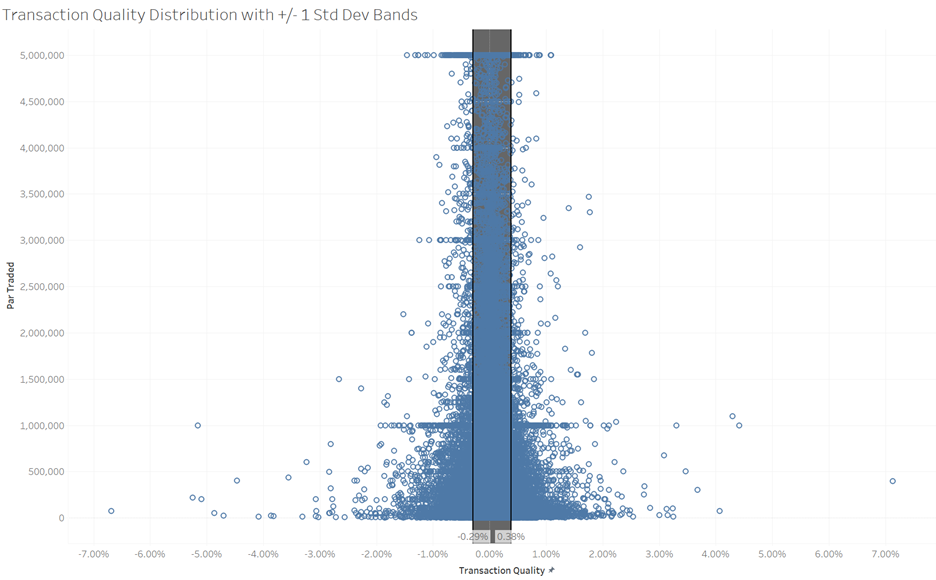
Transaction quality scores for portfolio trades are not normally distributed. For this measurement we are focused on trades where the total cost is measured using contemporaneous dealer-to-dealer trades, our largest category of transaction quality measurements. In a normal distribution approximately 68.3% of observations are within one standard deviation of the mean. In our transaction quality data approximately 80.8% of observations are within one standard deviation of the mean. There is also a slight left-hand skew near the mean (mean = 4.6 bps, median = 3.9 bps).
At 2 and 3 standard deviations our data very closely resembles a normal distribution. This is important because we have chosen not to remove outliers from our data set. Because the outliers offset each other there is little impact on our mean or median. The mean and the median of the distribution trimmed at plus and minus three standard deviations are identical at the tenth of a basis point.
It seems likely that extreme outliers are the result of either trade reporting errors (which we know to exist in the TRACE feed) or the process for deriving individual bond prices from a single portfolio price. Individual bond prices within a portfolio trade are not exempt from best execution or fair pricing regulations. While that should introduce a natural bounding effect on price outliers, it is still possible that some of the outliers we observe in the data are a result of the price allocation process when translating from a single portfolio price to multiple individual bond prices.
Conclusion
At a high level of granularity and for a relatively small data set, the cost effectiveness of portfolio trading appears to be demonstrated. In price terms, savings of 4.6 basis points (versus the dealer-to-dealer market) to 6.6 basis points (versus the institutional customer market) have been attained in the first one and a half months that the portfolio trading flag has been available on disseminated trades. But “high level of granularity” is the key phrase. It is possible that all the gains accrued to a subset of the portfolio trades at the expense of other portfolio trades. To determine where the performance comes from, we will need to organize the reported trades into unique portfolios and measure each outcome. This will also help us measure the potential liquidity subsidizing effects that are believed to be one of the major benefits of portfolio trading. This will be the topic of our next paper on portfolio trading.
