Trade Insights – Volume 21
What BondWave’s Transaction Quality Analytics Benchmarks Reveals About Fundamental Changes in the Corporate Bond Trading Environment
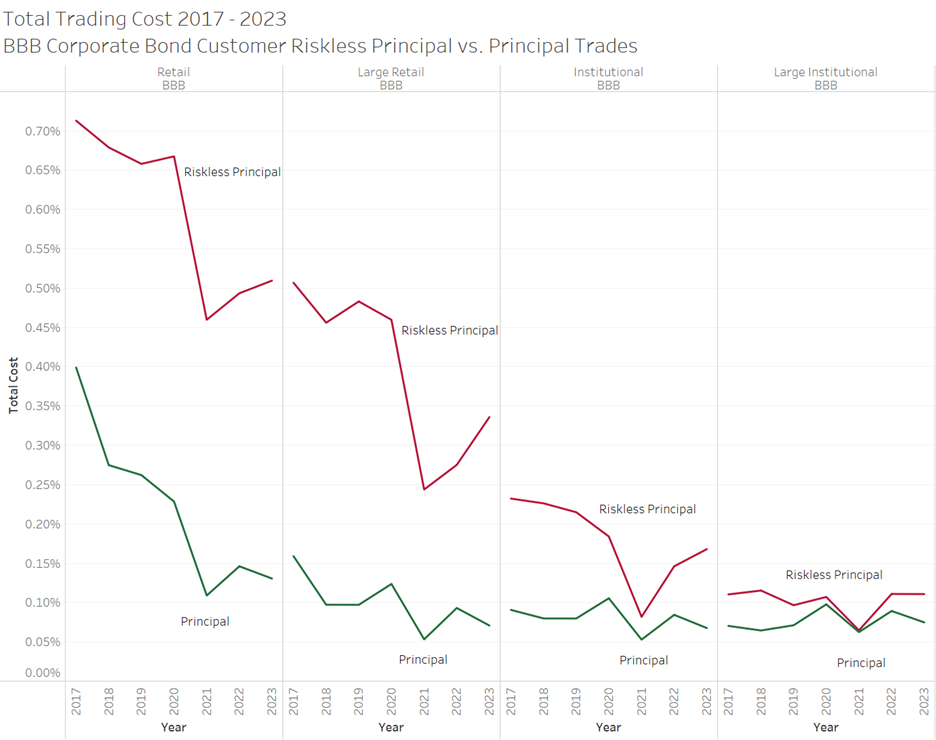
Using BondWave’s Transaction Quality Analytics Benchmarks, it becomes clear that from 2017 through 2023 corporate bond total trading costs have decreased. The drop is significant for all but the largest trades (Graph 1).
Retail trades (100 bonds and less) in 2023 now cost approximately what large retail trades (101 to 250 bonds) cost in 2017. And large retail trades in 2023 now cost approximately what institutional trades cost in 2017 (251 bonds to 1 million). And institutional trades in 2023 now cost approximately what large institutional trades (greater than 1 million) cost in 2017. In short, trades of all sizes benefit from greater efficiency in fixed income trading.
Another noteworthy trend is that while riskless principal trades are still more expensive than principal trades the gap is slowly shrinking. It is not clear that the gap will ever disappear though. The question will always be whether the increased search costs involved in principal trading are greater than the transaction cost benefits they provide.
It is likely that decreases in trading costs are related to several interconnected innovations and trends in fixed income trading: portfolio trading, electronification, and corporate bond ETF growth.
Graph 1
Likely Sources of Greater Efficiency
Portfolio Trading
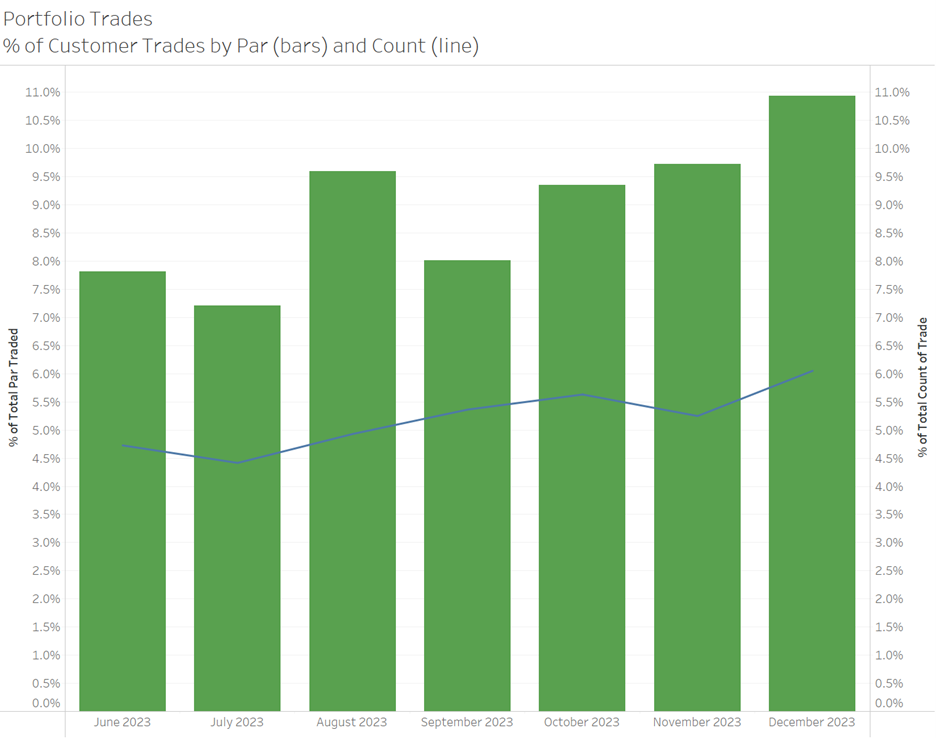
Beginning on May 15, 2023, corporate bond portfolio trading could be observed directly as FINRA added a new portfolio flag to disseminated trade data. Beginning with the first full month this data has been available, June 2023, portfolio trading has grown from 7.8% to 10.9% of customer par value traded (Graph 2).
Graph 2
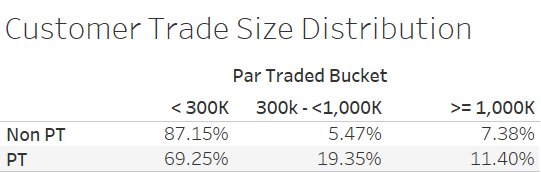
Portfolio trading is an exclusively institutional execution strategy, yet the average trade size for a line item in a portfolio trade is well below what has historically been considered institutional size. Since May 15, 2023, the average customer trade size for an item in a portfolio is $422,739, whereas the average trade size for non-portfolio customer trades is $236,246.

Approximately 69% of portfolio trade line items are less than $300,000. This is significant because it represents institutions who can negotiate volume discounts and apply them to what is normally considered to be a non-institutional trade size. This alone can explain a large amount of the decrease in trade costs for retail and large retail trade sizes.
Increased Electronification
One effect of the pandemic that has been frequently commented on is that working from home paved the way for a growth in electronic trading. SIFMA estimates that electronic trading market share of US Corporate IG bonds has grown from approximately 22% of volume in January 2019 to 40% by November 2022. At the same time HY electronic trading market share has grown from approximately 12% to 30%.[1]
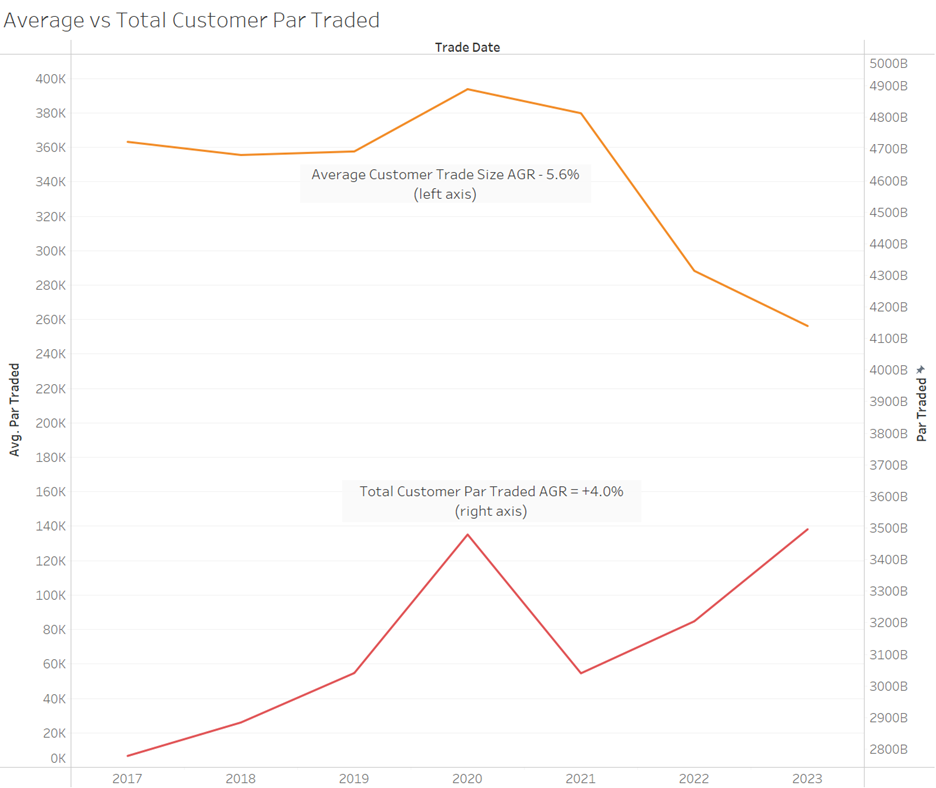
The move to greater electronic trading is correlated with shrinking average trade sizes even as overall volume has grown. From 2017 to 2023 total customer notional traded has grown at a 4.0% annualized rate. In that same time the average trade size has shrunk at a 5.6% annualized rate (Graph 3).
Graph 3
Credit ETF Growth
From humble beginnings in 2002, US credit ETFs now have $147.7 billion in assets according to Bloomberg. Adding in the corporate allocation from US aggregate ETFs brings the total over $200 billion. The growth of credit ETFs has led to other network effects for trading costs and liquidity. Market makers in credit ETFs are most directly responsible for the growth in portfolio trading. And portfolio trading has been shown to be more cost effective than RFQ trading with much of those gains correlated with membership in an ETF and trading in a risk reducing direction relative to ETF flows.[2]
ETF market makers have now begun to branch out to making markets at scale in individual bonds. This represents a new pool of capital competing for flow. And competition for flow always results in lower trading costs.
About BondWave’s Transaction Quality Analytics Benchmarks
BondWave’s Transaction Quality Analytics (TQA) Benchmarks are a simple, effective way to compare transaction costs to your peers. Built from over 800 million transaction cost calculations, the TQA benchmarks are specific to the type of trade analyzed including size, side of market, rating, execution style, and more. By comparing transaction costs to cost benchmarks traders, risk managers, and compliance officers can understand relative trading costs. After all, you cannot manage what you do not measure.
[1] A Report from Greenwich Associates & SIFMA Insights: Understanding Fixed Income Markets in 2023 (https://www.sifma.org/wp-content/uploads/2023/05/Understanding-Fixed-Income-Markets-2023-23-2007.pdf)
[2] Portfolio Trading in Corporate Bond Markets. March 3, 2023. Jeffrey Meli, Zornitsa Todorova (https://papers.ssrn.com/sol3/papers.cfm?abstract_id=4295453)
