Developed to help bond market participants better understand trading trends in the fixed income markets, BondWave’s Data Lab has released its QMarksTM dashboards for the first quarter of 2024.
QMarks is a proprietary BondWave data set that powers its quarterly dashboards to cover all disseminated bond transactions using the regulatory-prescribed Prevailing Market Price methodology for corporate, municipal, agency, and 144A. QMarks belongs to a suite of other BondWave proprietary data sets, including QCurves, QTrades, and QScores.
Q1 2024 Observations:
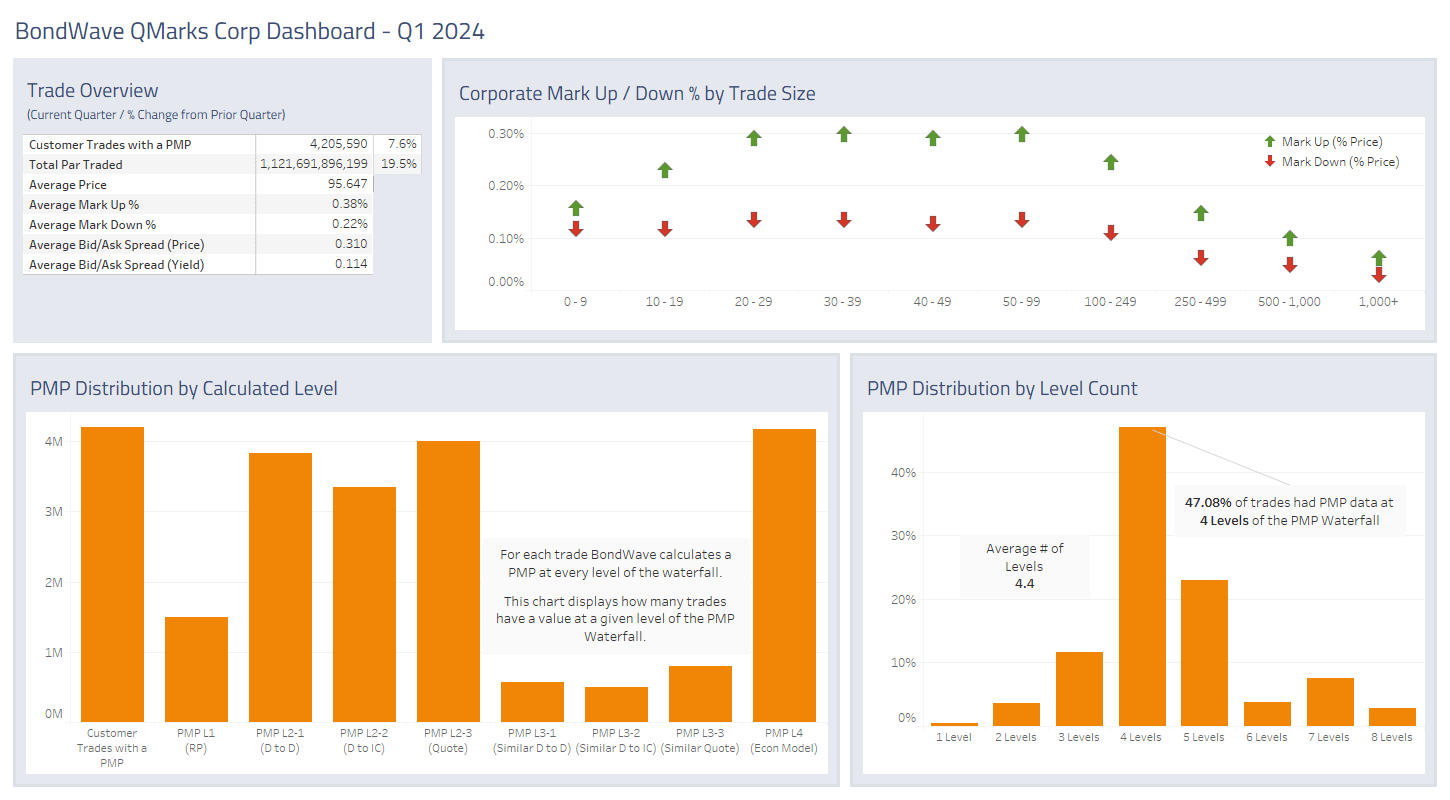
Corporate Bond Market Trends
- Corporate bond par value traded grew for the second consecutive quarter. With a 19.5% increase in par value traded, Q1 2024 was the most active quarter for corporate bonds since BondWave began producing dashboards.
- Average trade size continues to grow as well, as trade counts only grew by 7.6% in the quarter.
- Mark-ups and mark-downs were little changed in the quarter.
- Given the increased volume of trading and quote data, BondWave is able to produce an average of 4.4 ways to view a corporate bond’s fair value for any given trade.
Source: BondWave QMarks
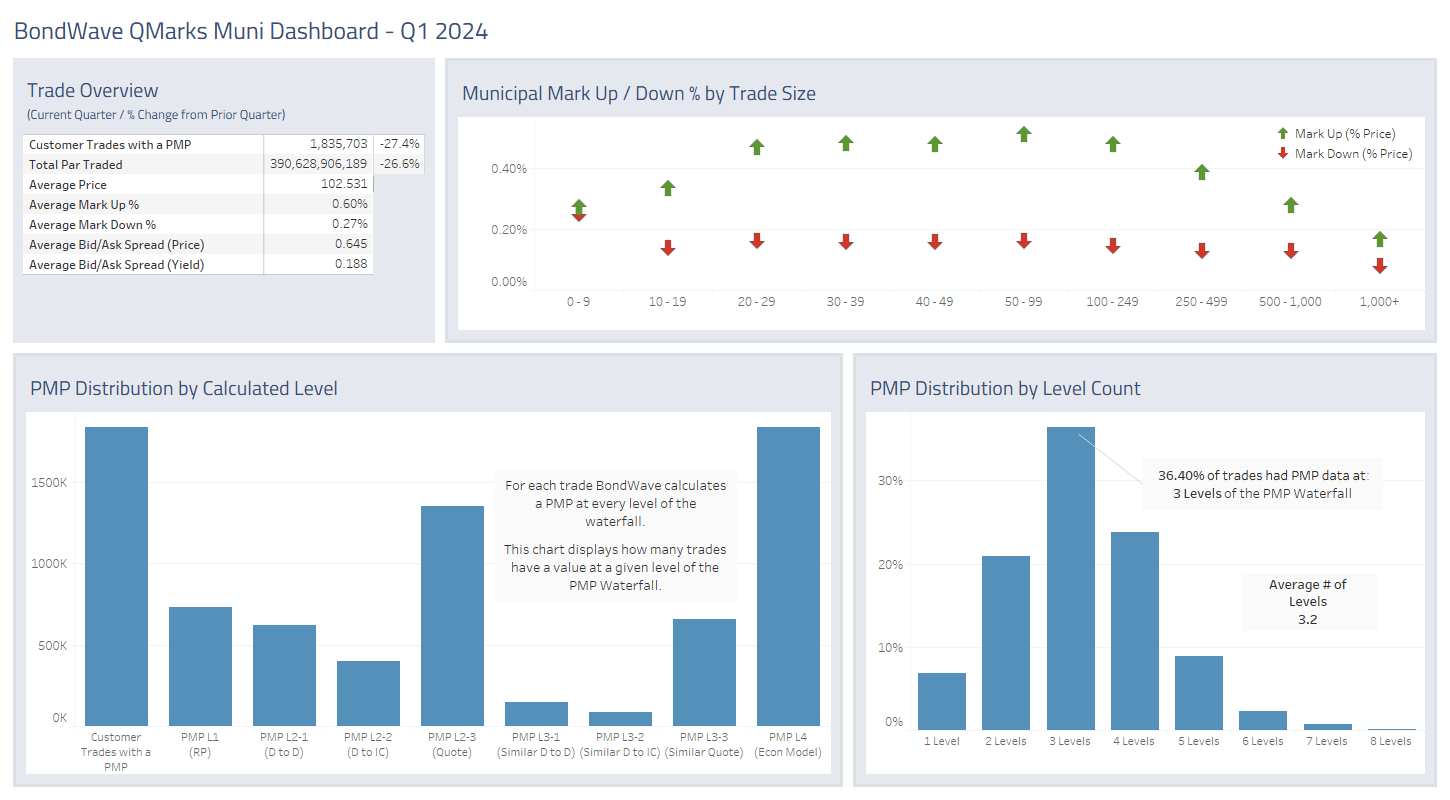
Municipal Bond Market Trends
- The municipal bond market did not participate in the growth experienced by the corporate bond market in the first quarter. But the municipal market was coming off a tough comp.
- After par value grew by 30% in Q4 2023, it shrunk by 26.6% in Q1 2024.
- Similarly, trade counts grew 36.8% in Q4 2023, but shrunk 27.4% in Q1 2024.
- Q1 2024 activity was on par with Q3 2023 activity.
- Mark-ups and mark-downs were little changed in the quarter.
- BondWave is able to produce an average of 3.2 ways to view a municipal bond’s fair value for any given trade.
Source: BondWave QMarks
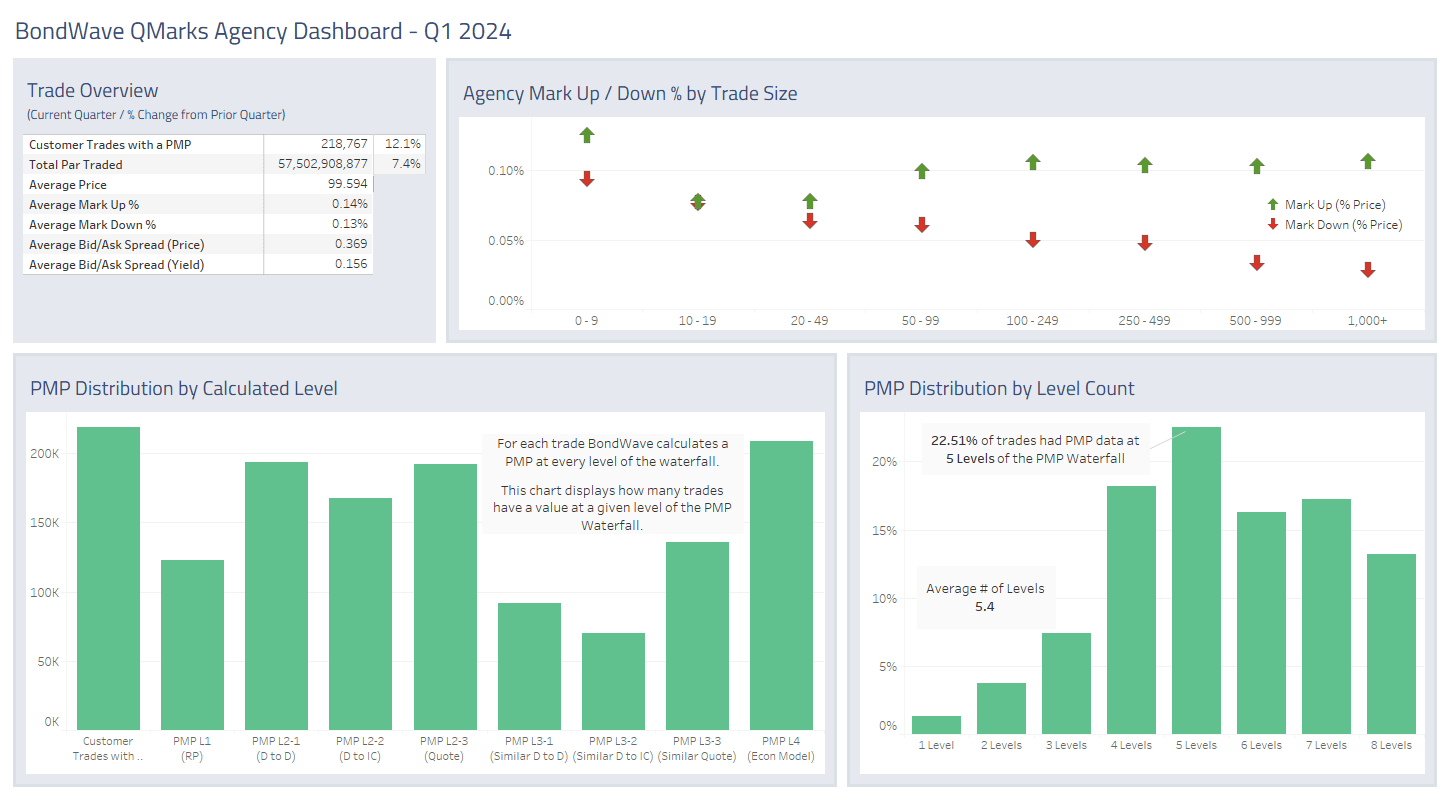
Agency Bond Market Trends
- Agency trading volumes grew in Q1 2024. Both par traded (+7.4%) and trade counts (12.1%) participated in the growth.
- Like the corporate bond market, the agency bond market was the most active BondWave has seen since producing our dashboards.
- With the increase in activity percentage mark-ups and mark-downs have nearly converged.
Source: BondWave QMarks
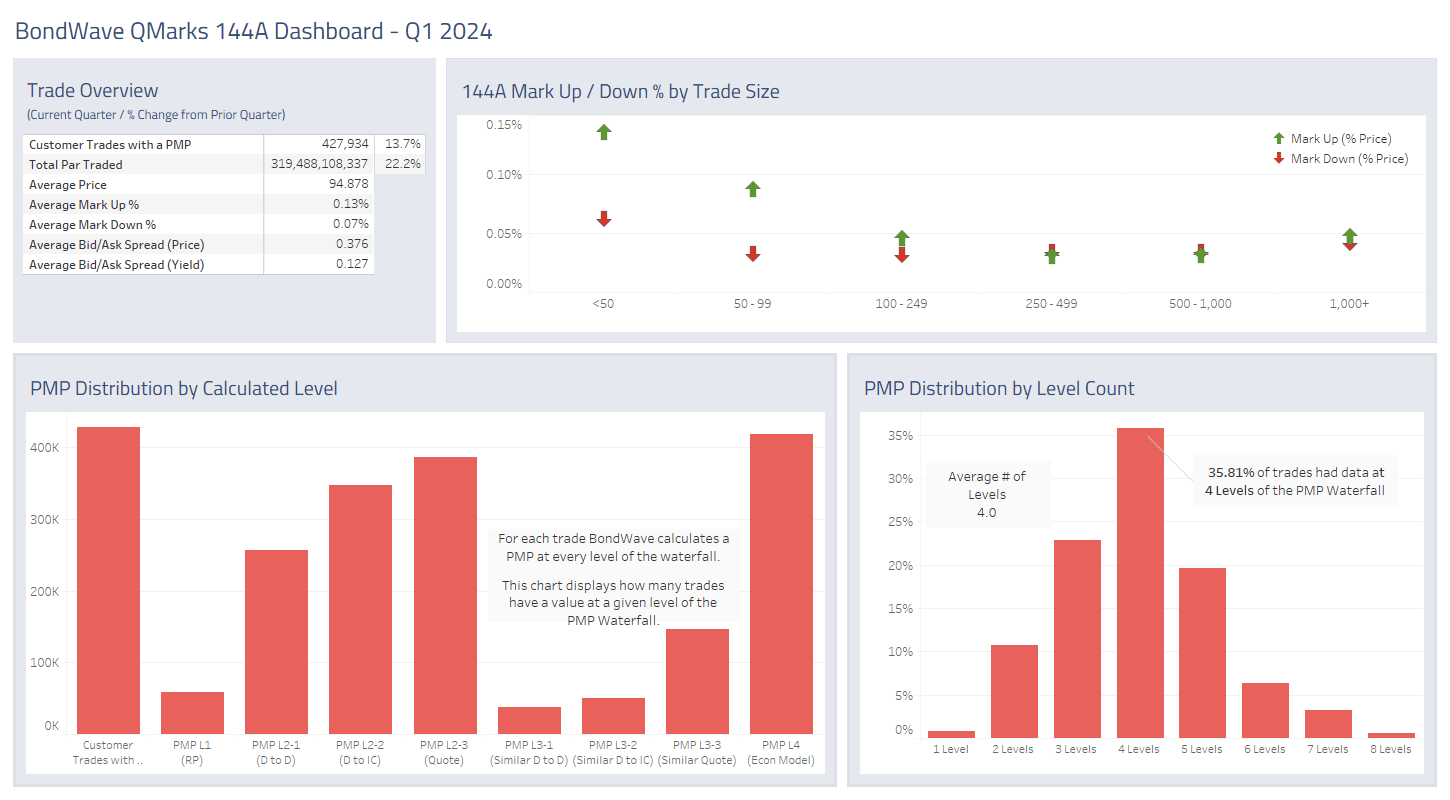
144A Bond Market Trends
- 144A trading volumes grew significantly in Q1 2024. Both par traded (+22.2%) and trade counts (13.7%) saw double digit growth.
- 144A trading was also the largest BondWave has seen since producing our dashboards.
- However, the increased activity did not help mark-ups as they increased by 2 basis points, on average, in the quarter.
Source: BondWave QMarks
Dashboards for the previous quarters referenced above are located here:
Last quarter: Q4 2023 Dashboards
Third quarter of 2023: Q3 2023 Dashboards
