Developed to help bond market participants better understand trading trends in the fixed income markets, BondWave’s Data Lab has released its QMarksTM dashboards for the first quarter of 2026.
QMarks is a proprietary BondWave data set that powers its quarterly dashboards to cover all disseminated bond transactions using the regulatory-prescribed Prevailing Market Price methodology for corporate, municipal, agency, and 144A. QMarks belongs to a suite of other BondWave proprietary data sets, including QCurves, QTrades, and QScores.
To keep our QMarks Dashboards up to date and informative, we are doing something a little different. We will begin rotating panels each quarter to showcase new information that highlights various elements of the fixed income market.
This quarter, we will focus on outliers. In the corporate and municipal bond dashboards, we will illustrate examples of trades on the tape that are significantly out of line with the market and peer comparisons. This quarter will highlight trades that were far too expensive.
Next quarter, we will look at examples on the other end of the spectrum – trades with superior execution quality. In Q3, we will pull back from individual trades to examine overall trends in outliers. In Q4, we will examine the role of slippage in fixed income trading.
Q1 2026 Observations:
Corporate Bond Market Trends
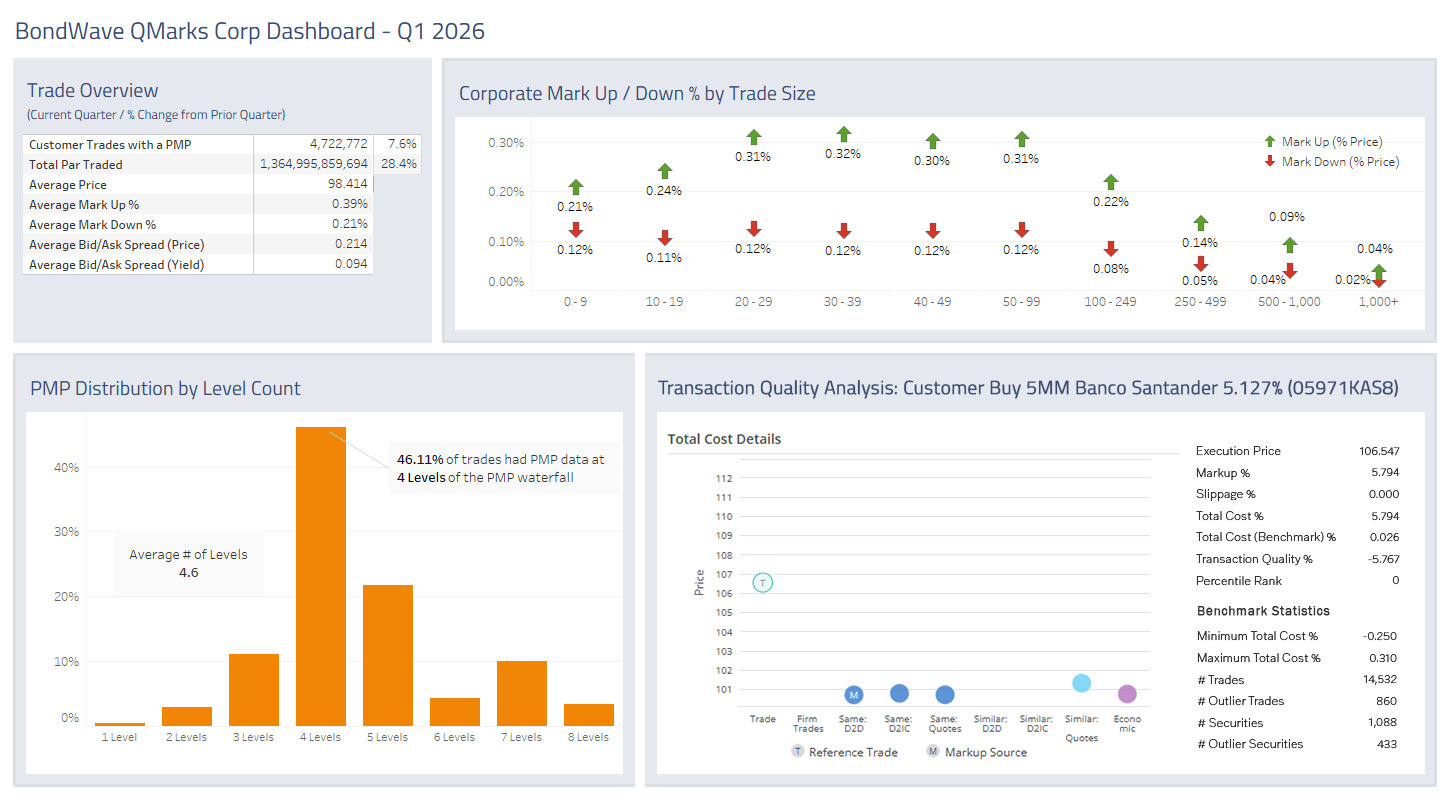
Source: BondWave QMarks
- Corporate volume grew in both the number of trades (+7.6%) and the amount of par traded (+28.4%).
- As is typically the case, average trade size grew in the quarter. However, the longer-term trend is still smaller.
- Trade Outlier Terms:
- Customer paid 106.547 for 5,000,000 Banco Santander 5.127% Snr Non-Pref Notes maturing 6/11/2035 (CUSIP 05971KAS8)
- Execution price was 5.8% above the prevailing market price
- Peers paid only 2.6 basis points to execute similar trades
- Over 14,500 trades were identified in the peer group
- 860 trades were identified as outliers and not used in the peer group – including this trade
-
There are several ways to interpret this trade. One is that it is a terrible fill on an institutional trade. Another is that it is a trade reporting error and the real price is 100.6547.
-
This trade highlights a central problem with fixed income data: quality control.
-
BondWave’s Transaction Quality process ensures that outlier data like this (whether it is accurate or inaccurate) is not used for cost calculations and comparison purposes.
144A Bond Market Trends
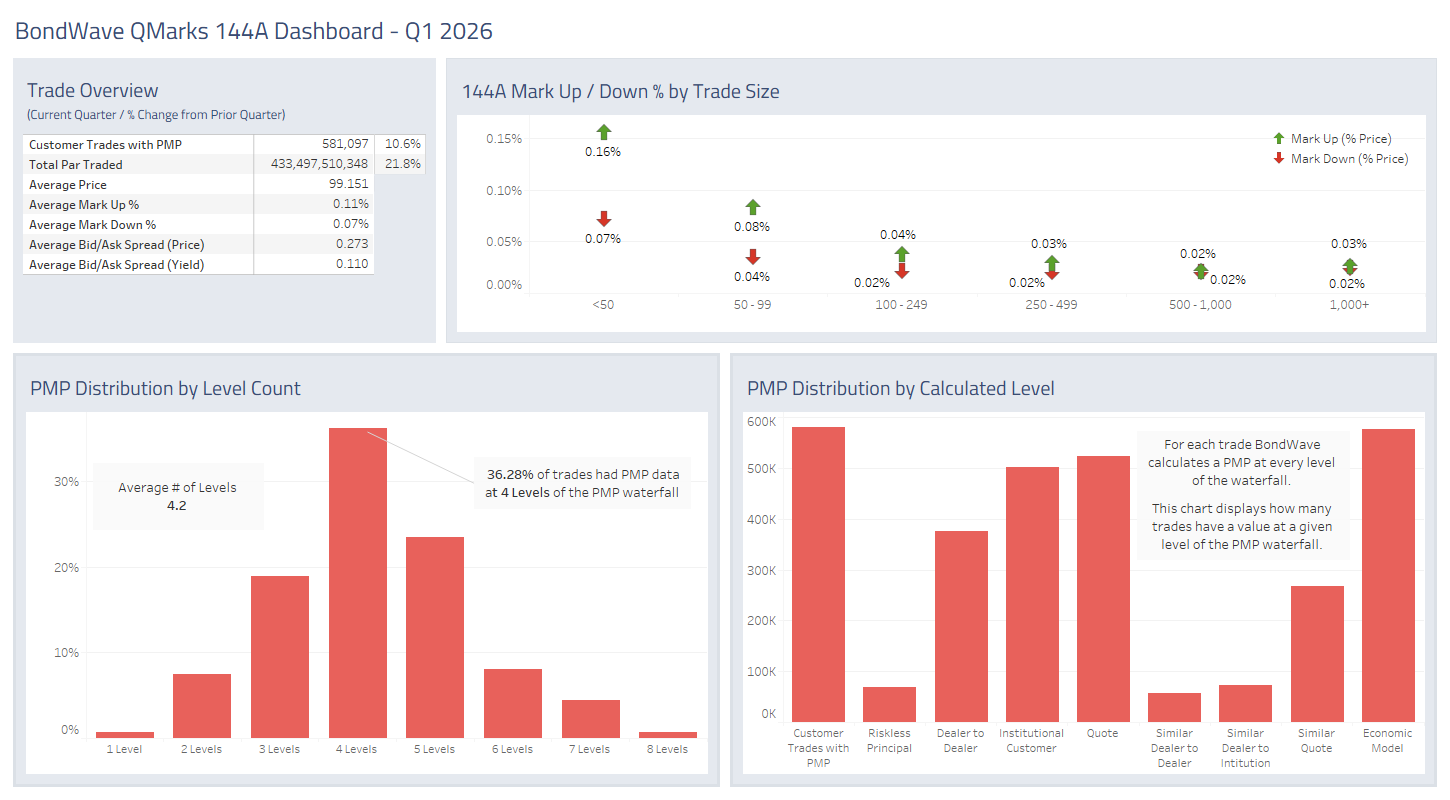
Source: BondWave QMarks
- Like their registered brethren, 144A volume grew in both the number of trades (+10.6%) and the amount of par traded (+21.8%).
- Average trade size is at its lowest value, having fallen 25% from its Q2 2019 high, reinforcing the notion that institutional trade sizes continue to shrink.
- BondWave’s own studies reveal that institutional trade costs are available for smaller and smaller trades.
Municipal Bond Market Trends
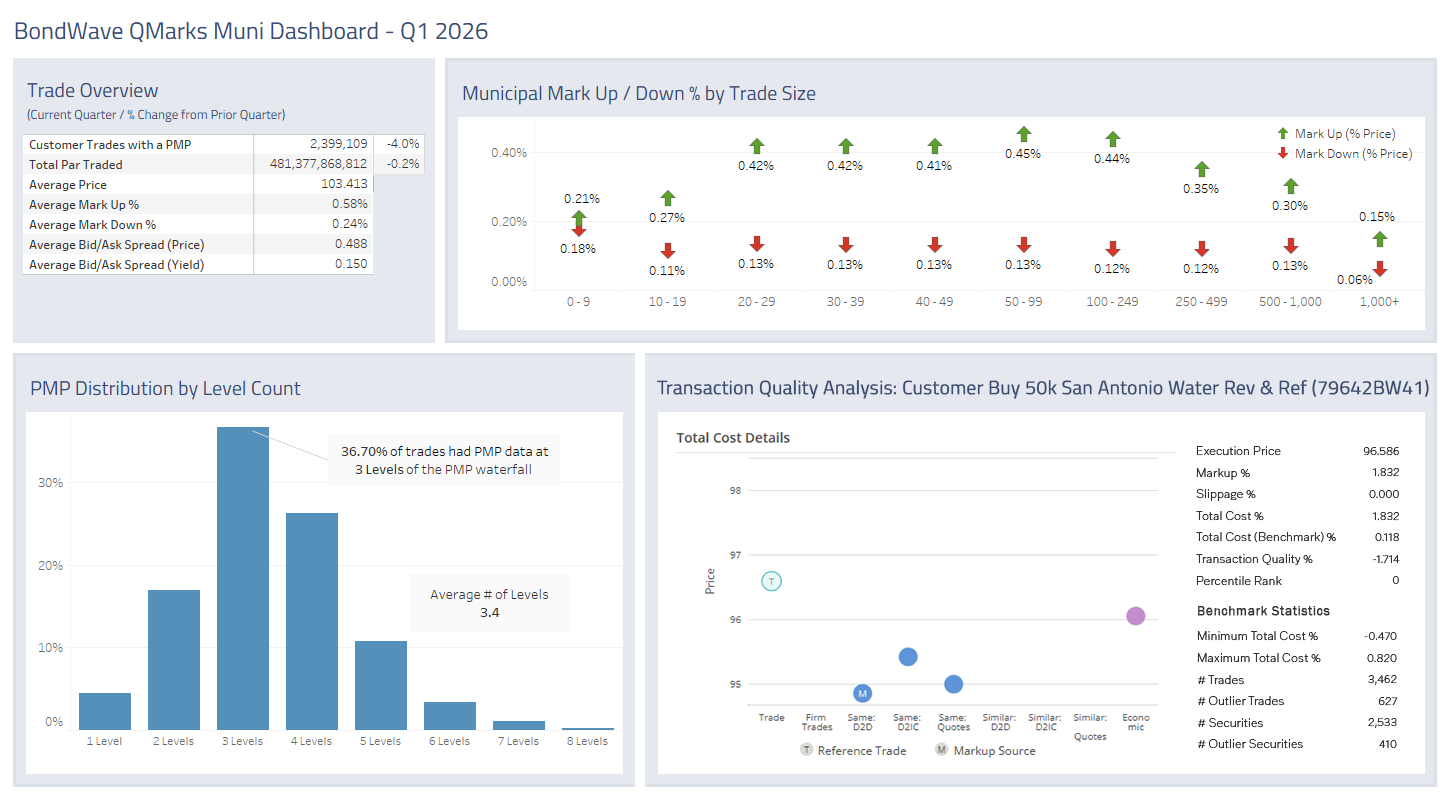
Source: BondWave QMarks
- Municipal volume shrank in both the number of trades (-4.0%) and the amount of par traded (-0.2%).
- Average trade size in the municipal universe continues to shrink from a high of 375k in Q1 2020 to the current level of 200k.
- Trade Outlier Terms:
- Customer paid 96.586 for 50,000 San Antonio Water Revenue 4% Bonds maturing 5/15/2045 (CUSIP 79642BW41)
- Execution price was 1.8% above the prevailing market price
- Peers paid only 11.8 basis points to execute similar trades
- Over 3,400 trades were identified in the peer group
- 627 trades were identified as outliers and not used in the peer group – including this trade
- Among the factors considered in observing the current market price were multiple dealer trades, multiple client trades for between 100 and 200 bonds, and an offer for 290 bonds – all at significantly better prices.
- With a total cost that exceeds peer costs by a multiple of 15x, this trade illustrates the need for improved pre-trade notions of fair prices, combined with a need to pursue an expanded pool of execution venues.
Agency Bond Market Trends
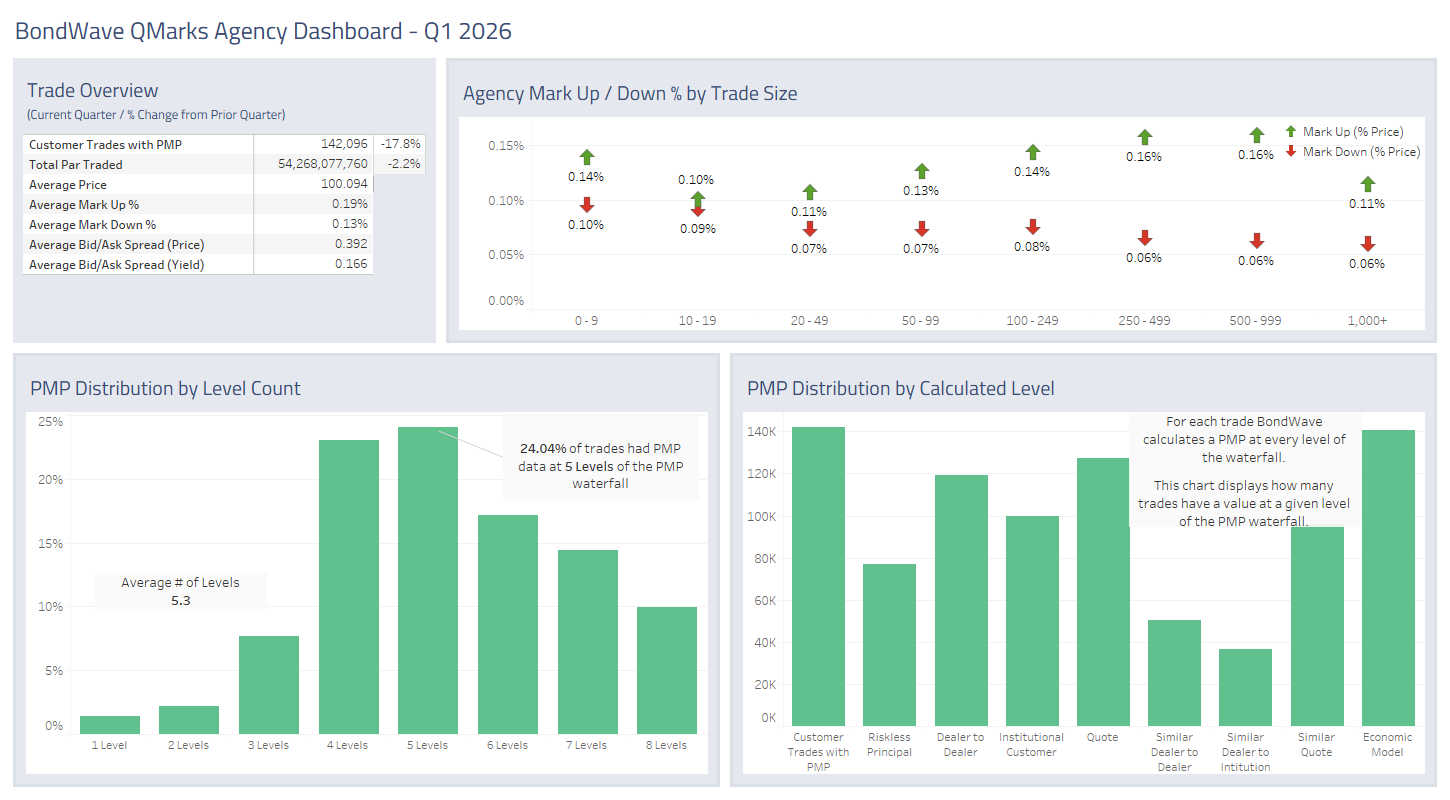
Source: BondWave QMarks
- Agency volume shrank in both the number of trades (-17.8%) and the amount of par traded (-2.2%).
- Average trade size is now less than half its pre-COVID size (~1.1MM vs ~400k).
Dashboards for the previous quarter are located here: Q4 2025 Dashboards
About BondWave LLC
Established in 2001, BondWave® is a financial technology firm specializing in fixed income solutions designed to enable clients to manage and expand their fixed income business with greater efficiency. We serve a wide range of clients, including traders, compliance professionals, RIAs, and asset managers, who use our tools to provide a superior fixed income experience to their clients while supporting critical regulatory mandates and optimizing workflows.
Effi®, our Engine for Fixed Income, is the single platform through which we deliver all our solutions – providing intuitive dashboards and insights into every fixed income position and transaction to drive informed investment and business decisions. Effi’s capabilities include Portfolio Oversight, Trade Oversight, and curated MuniNews. Our solutions are fueled by proprietary data sets that are developed using AI, machine learning technologies, and advanced data science.
