Developed to help bond market participants better understand trading trends in the fixed income markets, BondWave’s Data Lab has released its QMarksTM dashboards for the fourth quarter of 2023.
QMarks is a proprietary BondWave data set that powers its quarterly dashboards to cover all disseminated bond transactions using the regulatory-prescribed Prevailing Market Price methodology for corporate, municipal, agency, and 144A. QMarks belongs to a suite of other BondWave proprietary data sets, including QCurves, QTrades, and QScores.
Q4 2023 Observations:
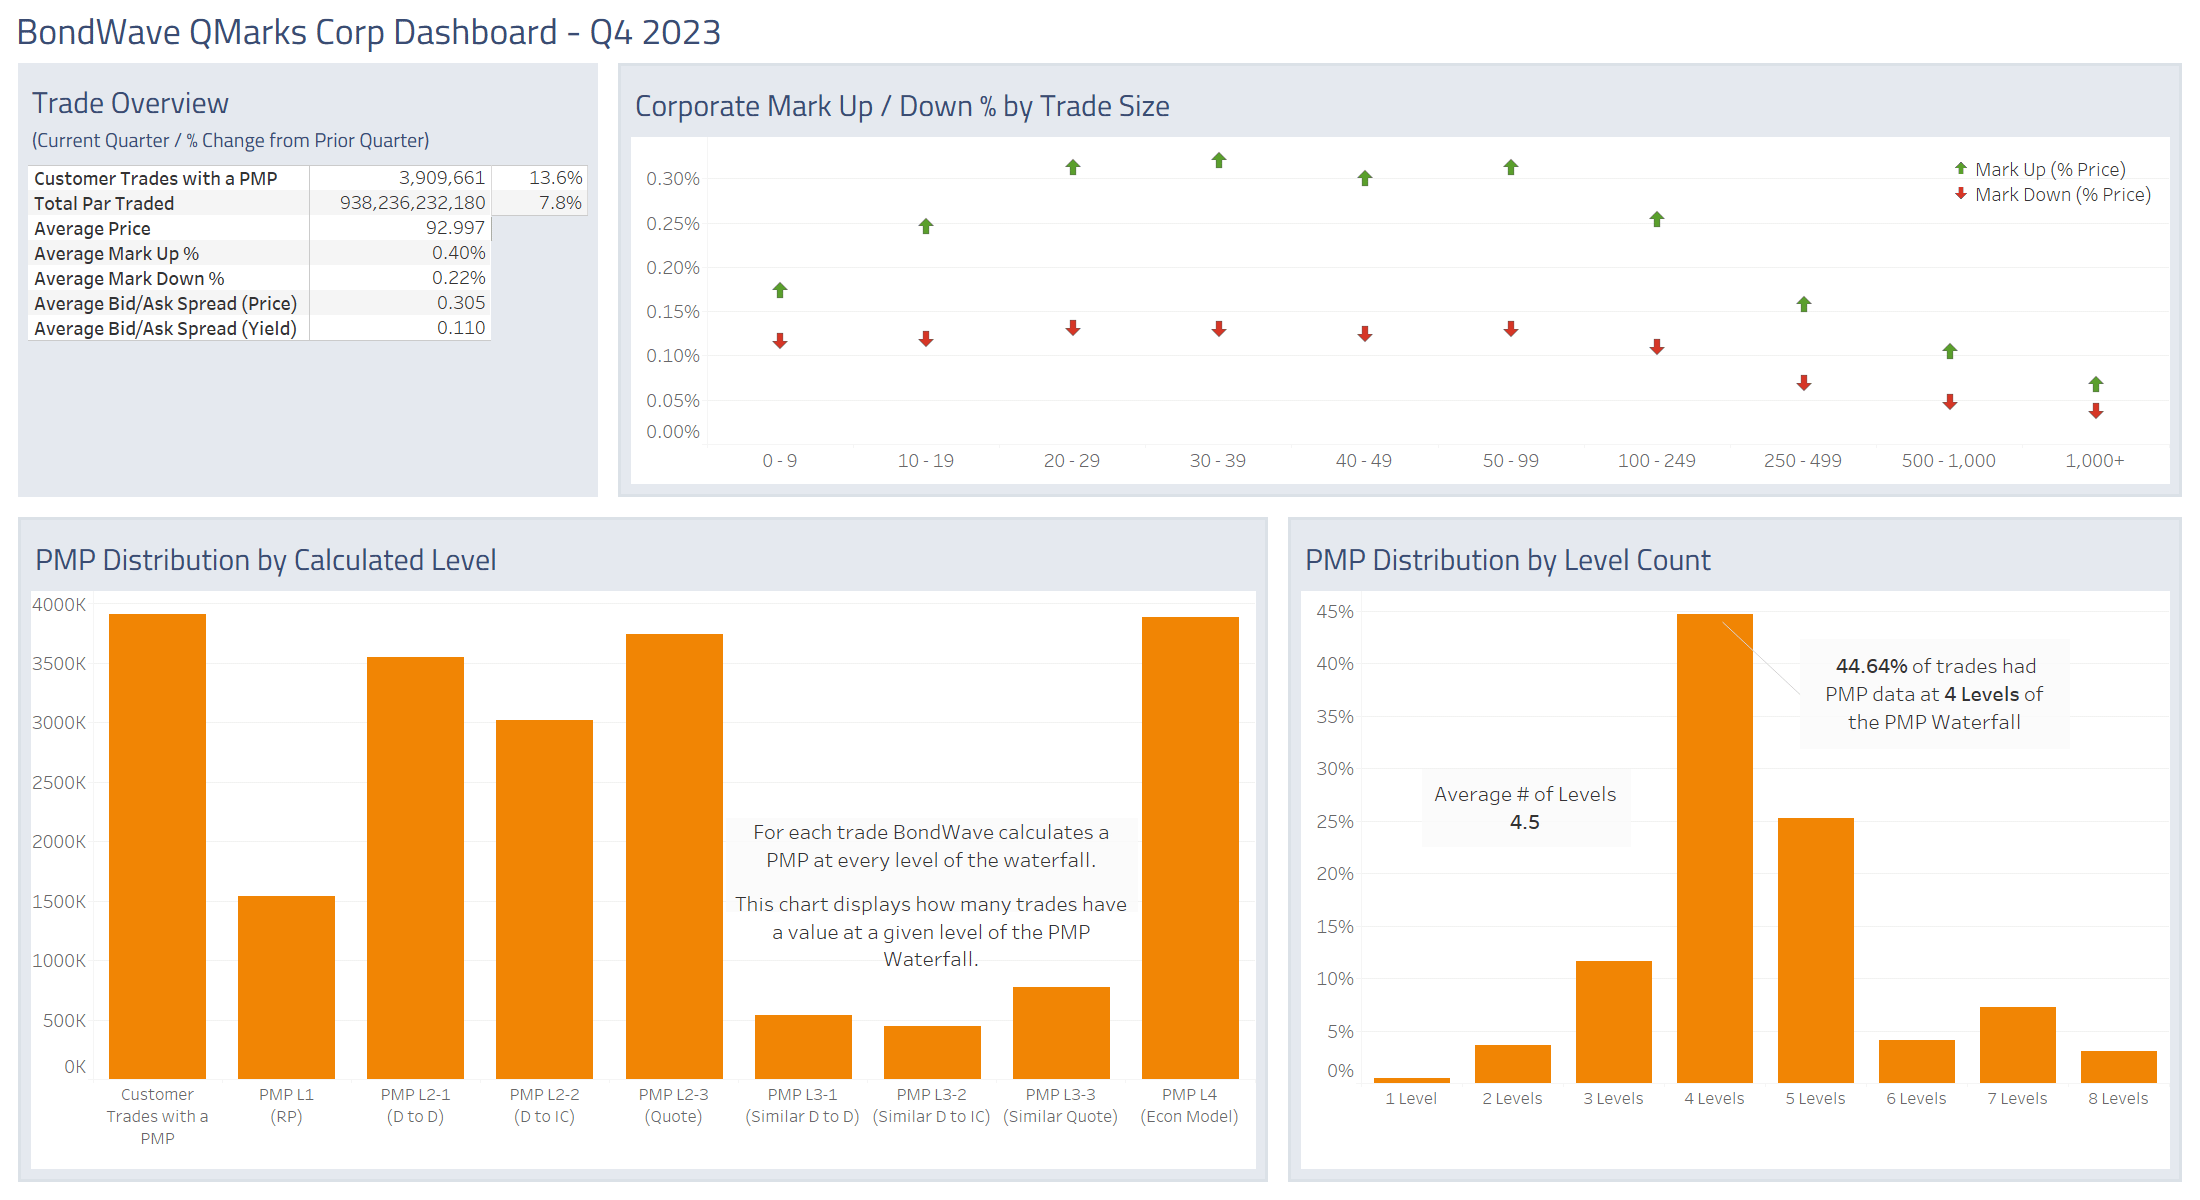
Corporate Bond Market Trends
- After two consecutive quarters of declines, customer par value traded rebounded in the fourth quarter finishing 7.8% higher than the third quarter (but still 7.1% below Q1 2023).
- The par value increase came as a result of many more trades (13.6% more than Q3 2023 which was the previous record) as the effects of growing electronic trading and portfolio trading continue to be felt.
- This led to an average trade size that shrunk to its lowest level ever at just $240,000. As recently as Q1 2021 average trade sizes were over $400,000.
- Mark-ups and mark-downs remained rock steady, as they have for the entire year.
Source: BondWave QMarks
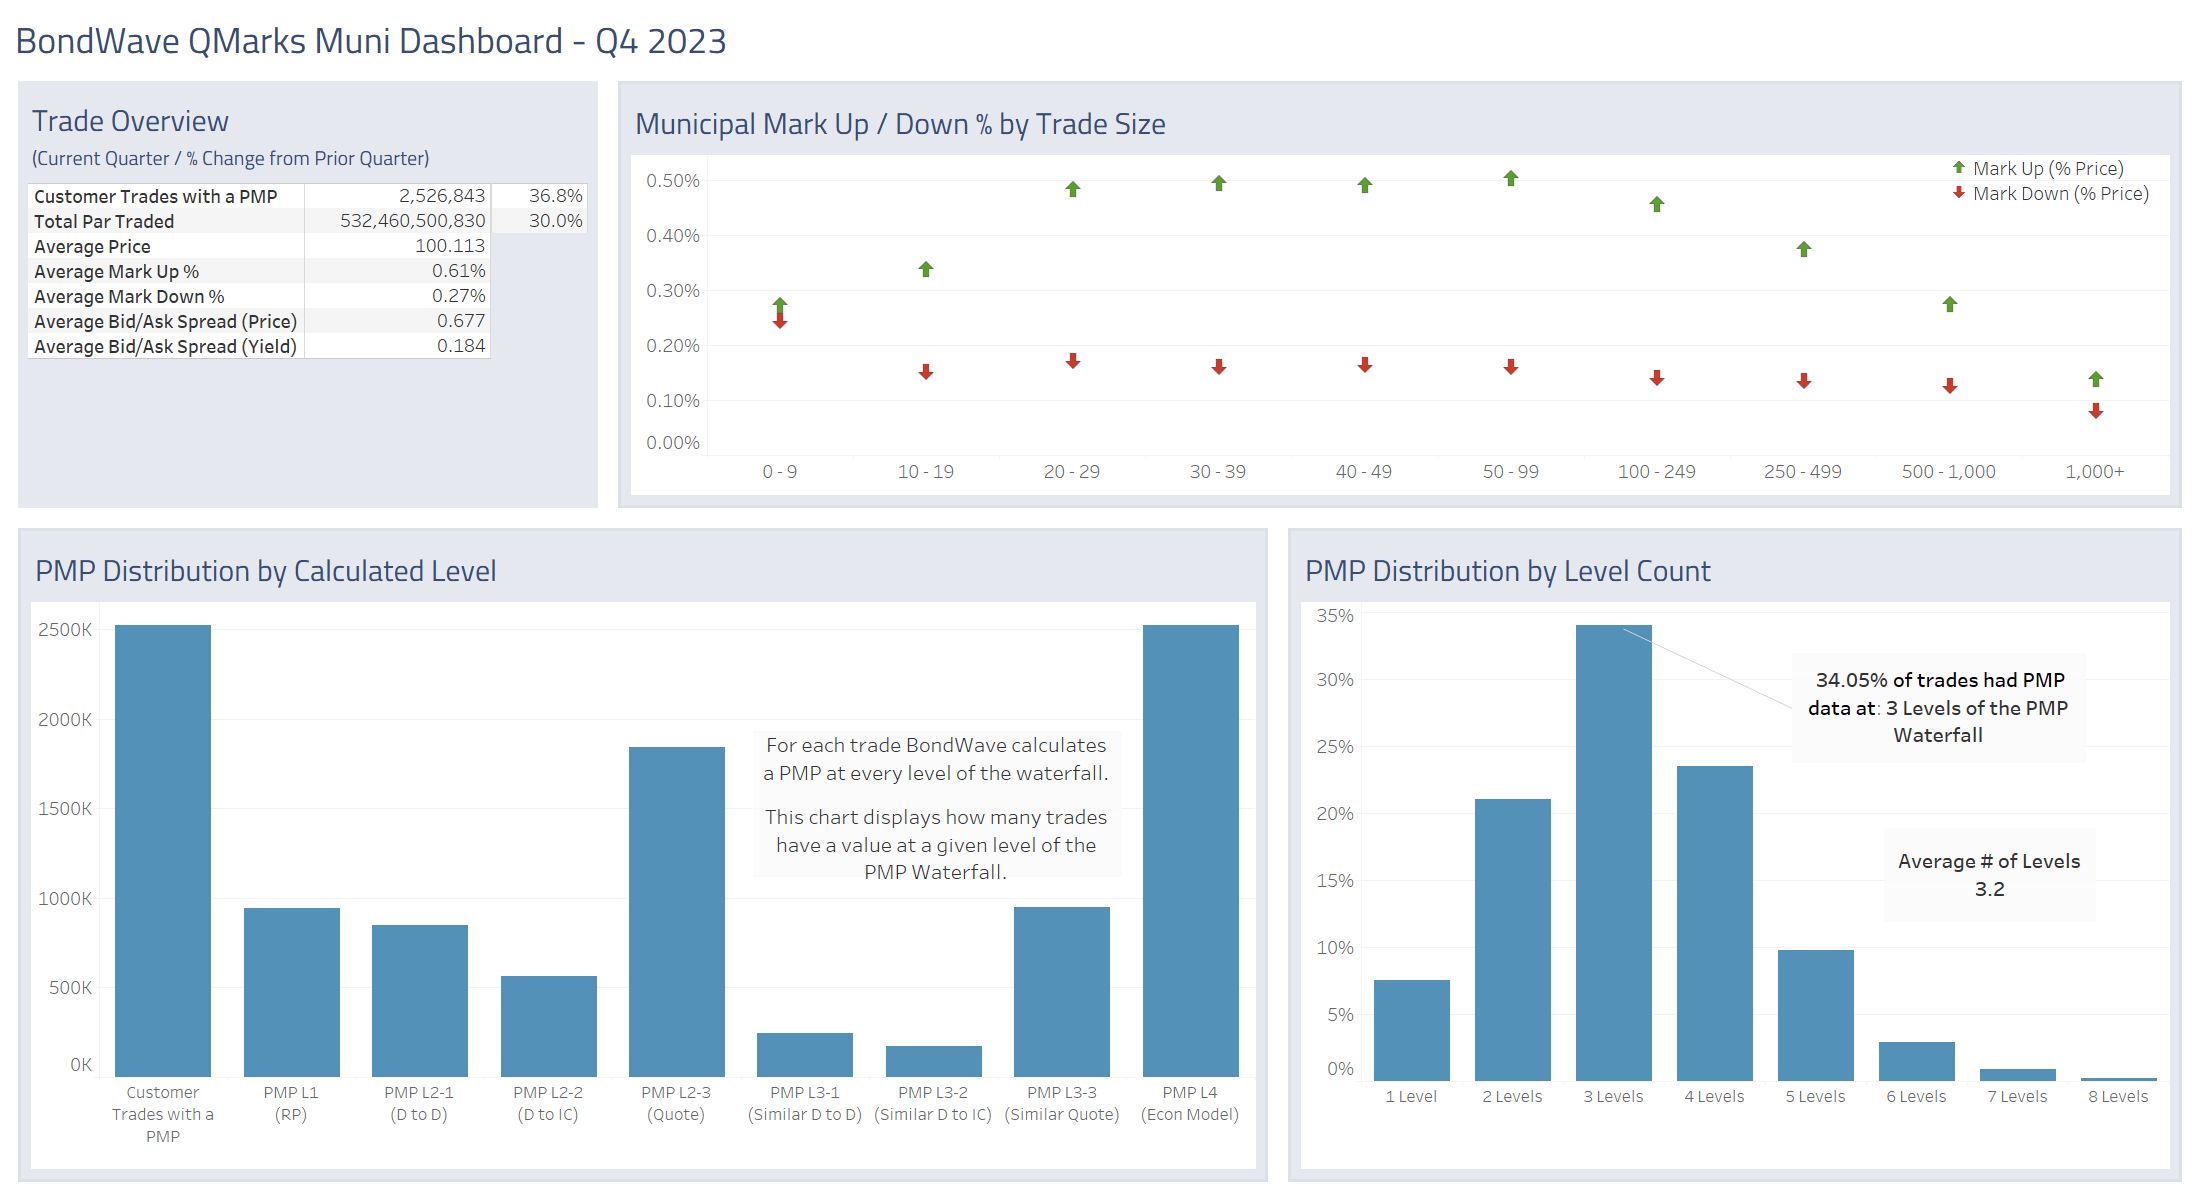
Municipal Bond Market Trends
- Municipal bonds saw the most significant growth in volume during the fourth quarter.
- Trades grew by a whopping 36.8% and par value grew by 30% over the third quarter.
- With the increase in volume, mark-ups shrank over 10% to 61 basis points from 68 basis points.
- Mark-downs were virtually unchanged quarter over quarter.
Source: BondWave QMarks
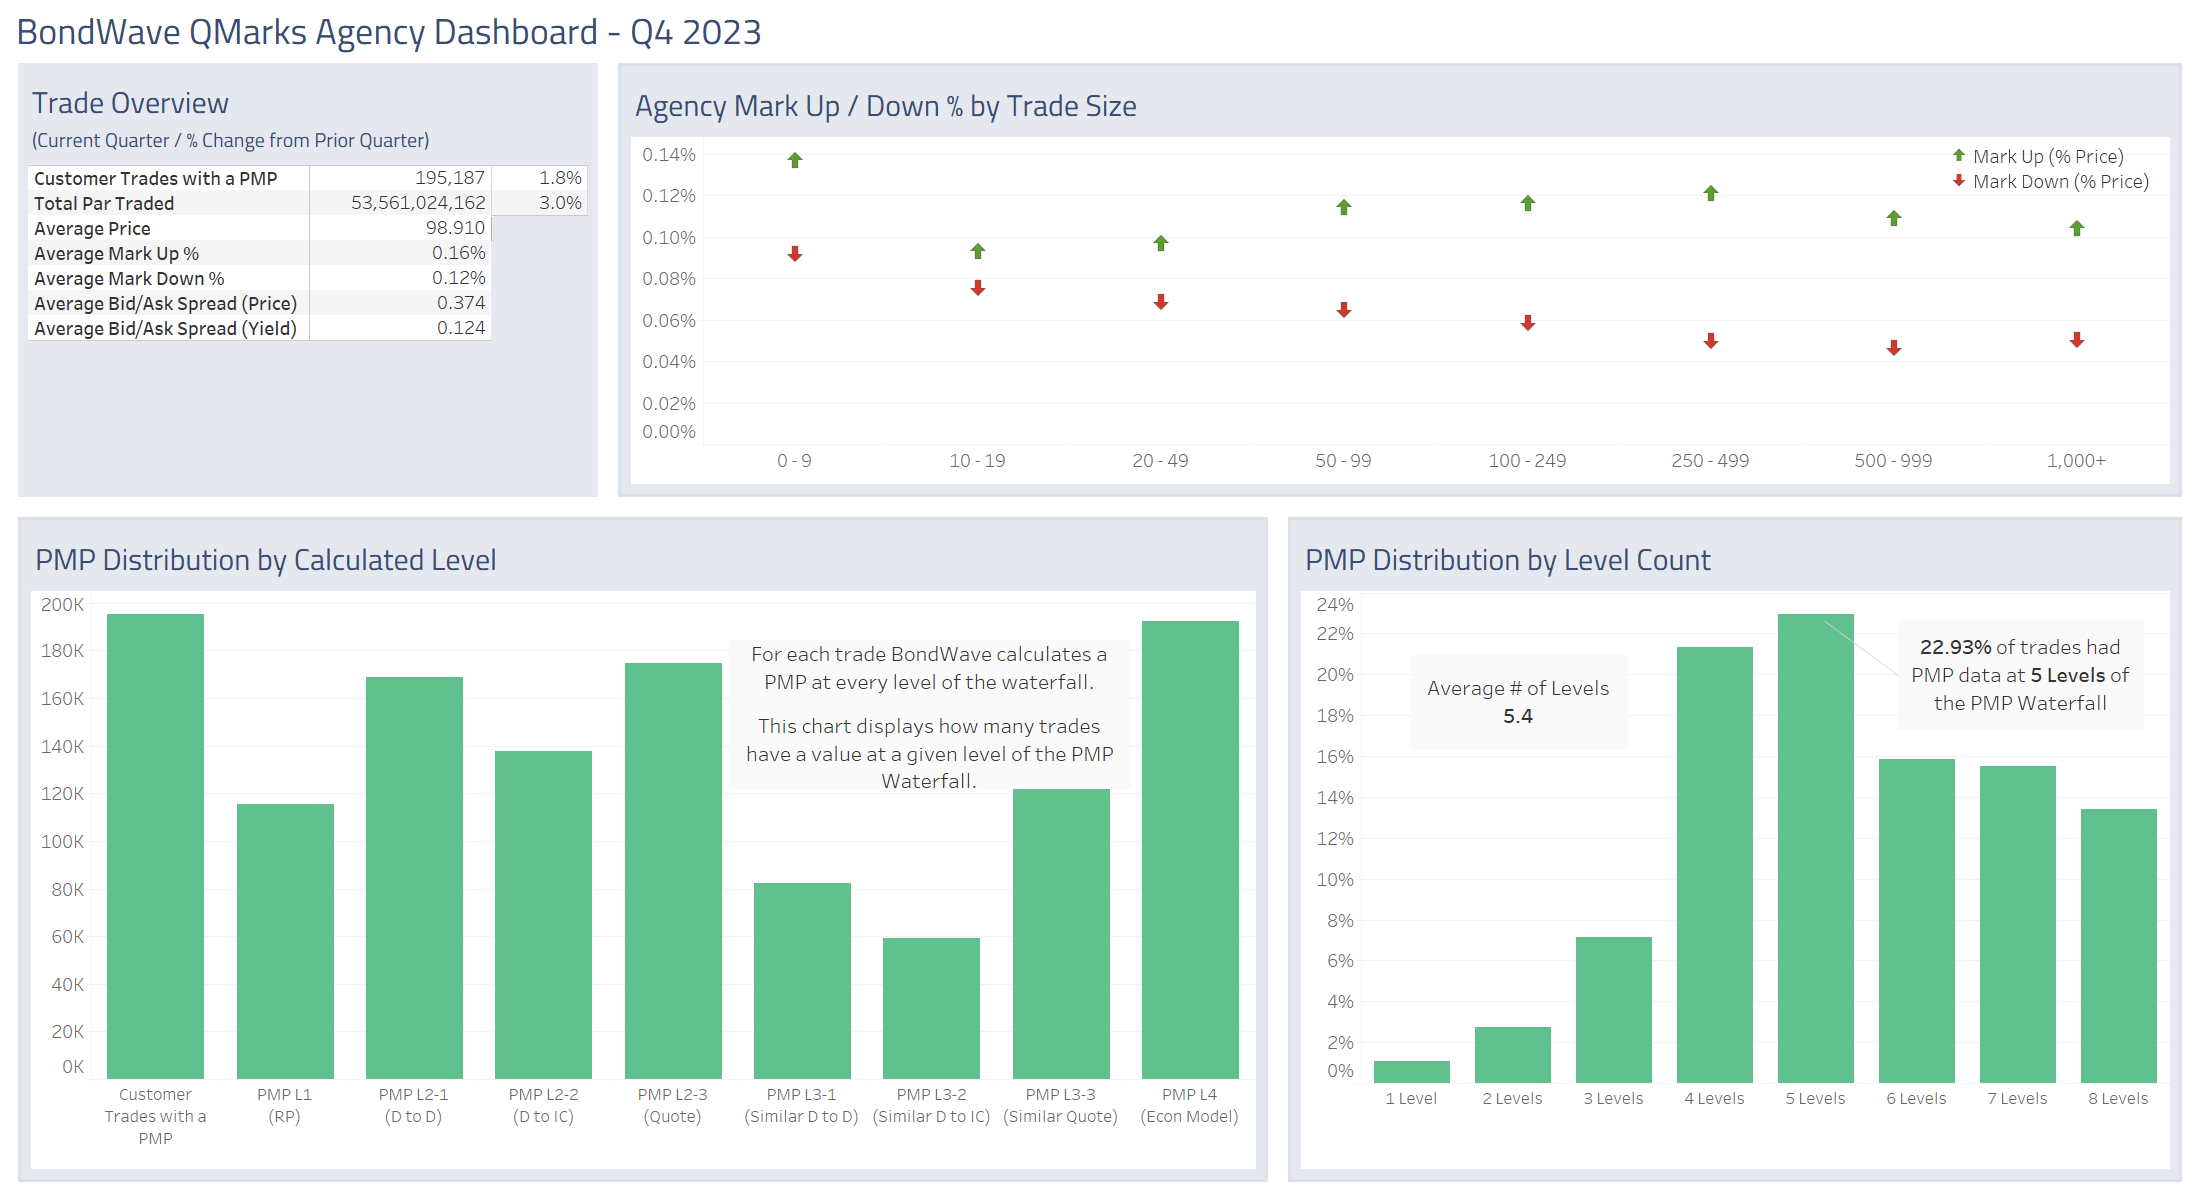
Agency Bond Market Trends
- Agency volumes grew modestly in the fourth quarter (1.8% more trades and 3% more par value).
- Mark-ups and mark-downs remained identical.
Source: BondWave QMarks
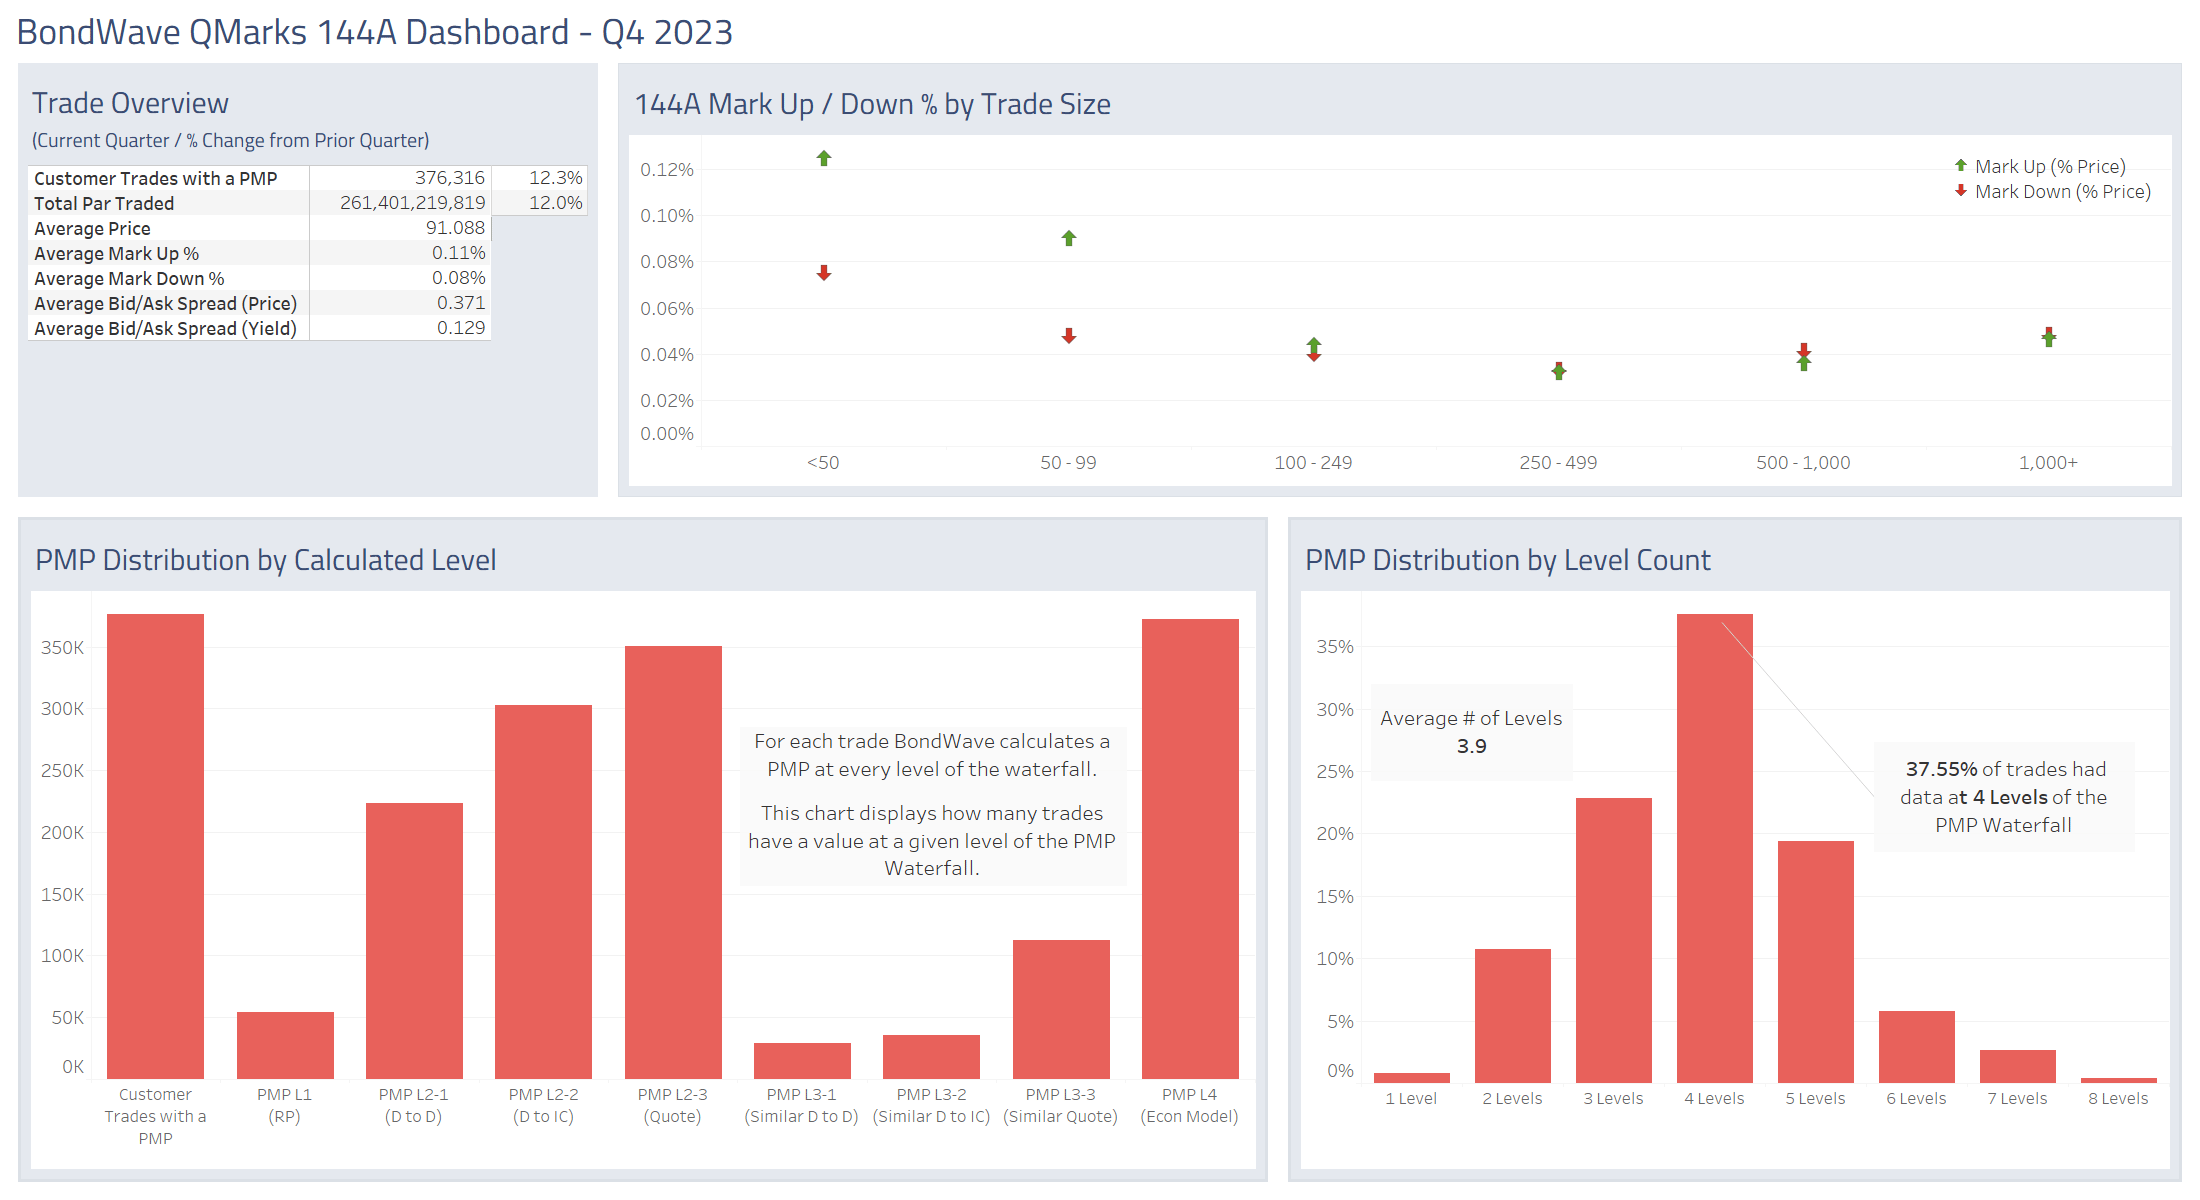
144A Bond Market Trends
- 144A bonds saw significant volume growth in the fourth quarter.
- Trades grew by 12.3% over the third quarter and par value grew by 12%.
- However, similar to registered corporates, the par value traded fell short of the highs reached in the first quarter.
- Mark-ups and mark-downs saw the most modest possible increase of 1 basis point each.
Source: BondWave QMarks
Dashboards for the previous quarters referenced above are located here:
Last quarter: Q3 2023 Dashboards
First quarter of 2023: Q1 2023 Dashboards
First quarter of 2021: Q1 2021 Dashboards (Corporate bond avg. trade size last peak)
