
Developed to help bond market participants better understand trading trends in the fixed income markets, BondWave’s Data Lab has released its QMarksTM dashboards for the second quarter of 2026.
QMarks is a proprietary BondWave data set that powers its quarterly dashboards to cover all disseminated bond transactions using the regulatory-prescribed Prevailing Market Price methodology for corporate, municipal, agency, and 144A. QMarks belongs to a suite of other BondWave proprietary data sets, including QCurves, QTrades, and QScores.
To keep our QMarks Dashboards up to date and informative, we are doing something a little different. We will begin rotating panels each quarter to showcase new information that highlights various elements of the fixed income market.
This quarter, we will continue our focus on outliers. In the corporate and municipal bond dashboards, we will illustrate examples of trades on the tape that are significantly out of line with the market and peer comparisons. Last quarter, we highlighted trades that were far too expensive. This quarter, we will examine the other end of the spectrum—trades that were executed in the most cost-effective manner possible.
In Q3, we will pull back from individual trades to examine overall trends in outliers. In Q4, we will examine the role of slippage in fixed income trading.
Q2 2026 Observations:
Corporate Bond Market Trends
Source: BondWave QMarks
-
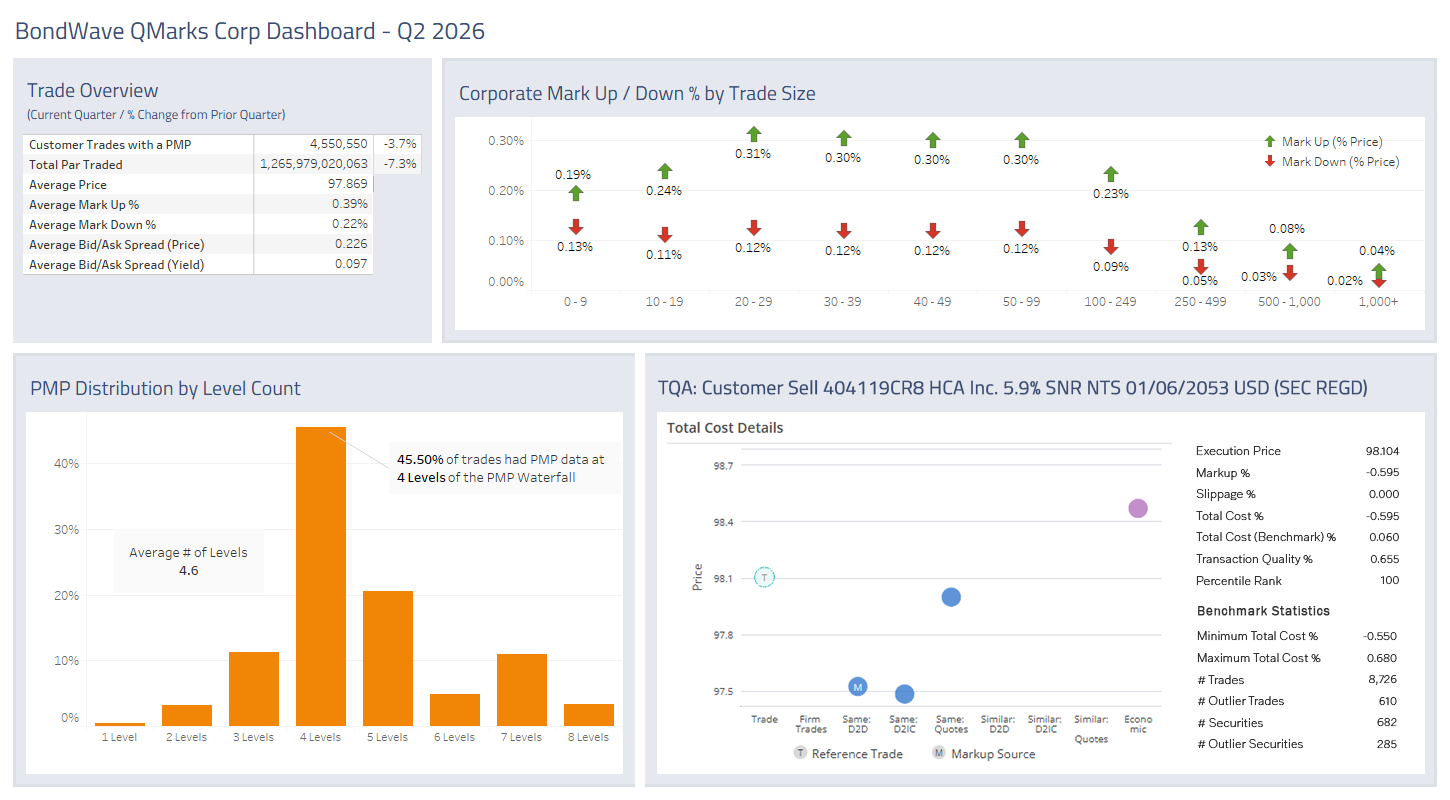
Q2 2026 volumes pulled back from their Q1 highs but remained above Q4 2025 levels.
-
Average trade size continued its rebound, growing for the second quarter in a row. From Q4 2025 to Q2 2026, average trade size has grown 15% (242k to 278.2k).
- Trade Outlier
- Terms:
-
Customer sell of 100,000 HCA 5.9% Senior Notes maturing 1/6/2053 (CUSIP 404119CR8) at 98.104.
-
The dealer acted as a principal on the trade.
-
Execution price was 60 basis points better than the dealer-to-dealer market, 64 basis points better than the dealer-to-institutional client market, and 11 basis points better than the quote.
-
More than 8,700 similar trades were examined as peer comparisons.
-
The median cost peers paid for similar trades was 6 basis points.
-
This means the trade outperformed its peers by 66 basis points, placing it in the top percentile for the quarter.
-
-
This trade illustrates the value of searching for the right counterparty.
-
Search costs can be very high in fixed income trading, but the benefits can be great.
- Terms:
144A Bond Market Trends
Source: BondWave QMarks
-
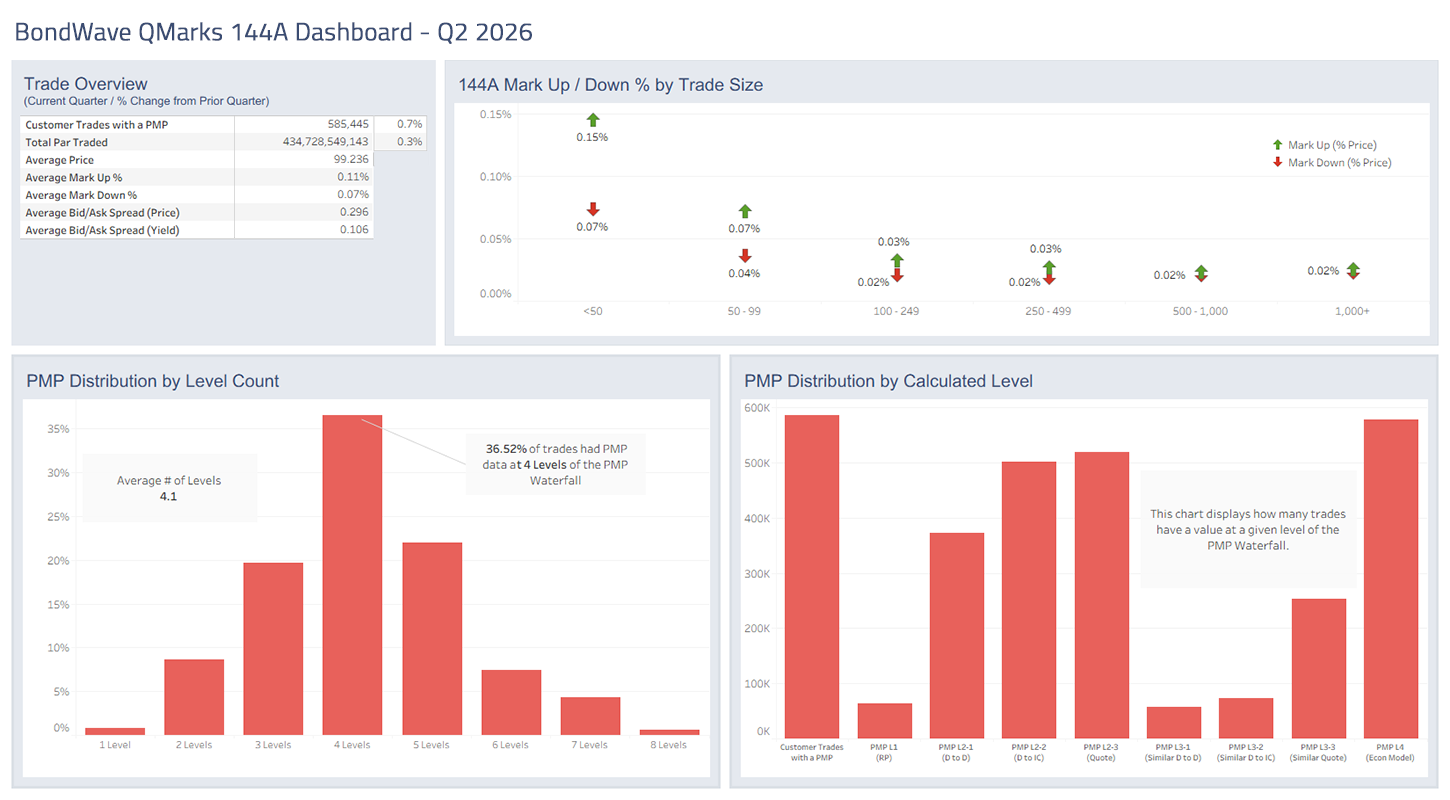
144A trading increased modestly in Q2.
-
Trade counts (+0.7%) and par traded (+0.3%) were slightly higher.
-
This has led to another quarter of shrinking trade sizes, setting another record low.
Municipal Bond Market Trends
Source: BondWave QMarks
-
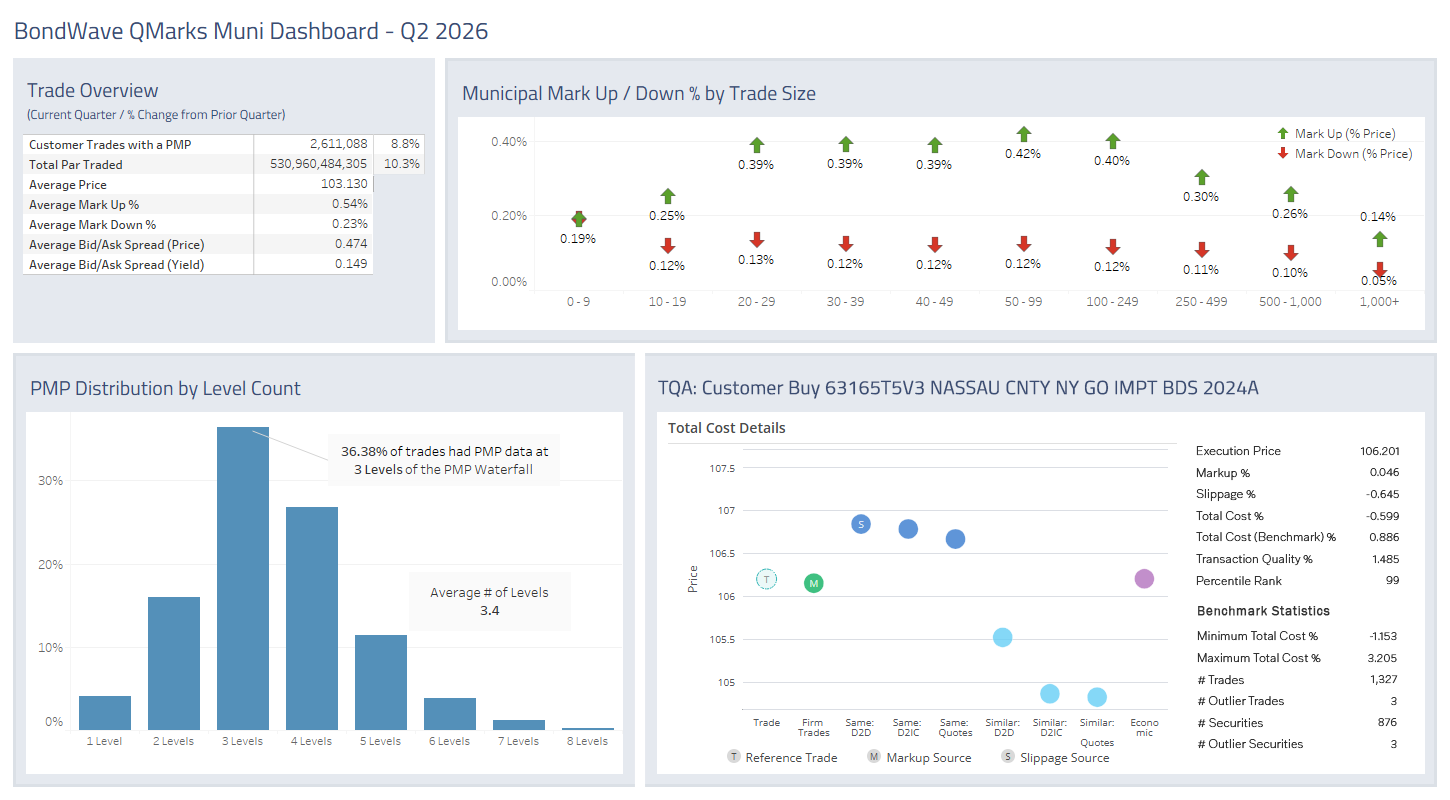
Q2 2026 volumes rebounded from Q1. Both total trades (+8.8%) and par traded (+10.3%) saw significant gains.
-
Customers also benefited from the greater volume as mark ups shrank 7% and mark downs shrank 4% relative to Q1.
- Trade Outlier
- Terms:
-
Customer paid 106.201 for 340,000 Nassau County 5% GO Impt Bonds maturing 4/1/2048 (CUSIP 63165T5V3).
-
The trade was executed on a riskless principal basis.
-
Mark-up on the trade was 5 basis points.
-
The broker executing the trade sourced the bonds from the street 65 basis points better than other dealer-to-dealer trades.
-
A negative value for slippage is price improvement.
-
As a result, the client received 60 basis points of net price improvement.
-
More than 1,300 similar trades were examined as peer comparisons.
-
The median cost peers paid for similar trades was 89 basis points.
-
This means the trade outperformed its peers by 149 basis points, placing it in the 99th percentile for the quarter.
-
-
This trade illustrates the value of good counterparty relationships.
-
By sourcing the bonds at the lowest possible price in the inter-dealer market, this broker delivered great value to their client while still earning a mark-up.
- Terms:
Agency Bond Market Trends
Source: BondWave QMarks
-
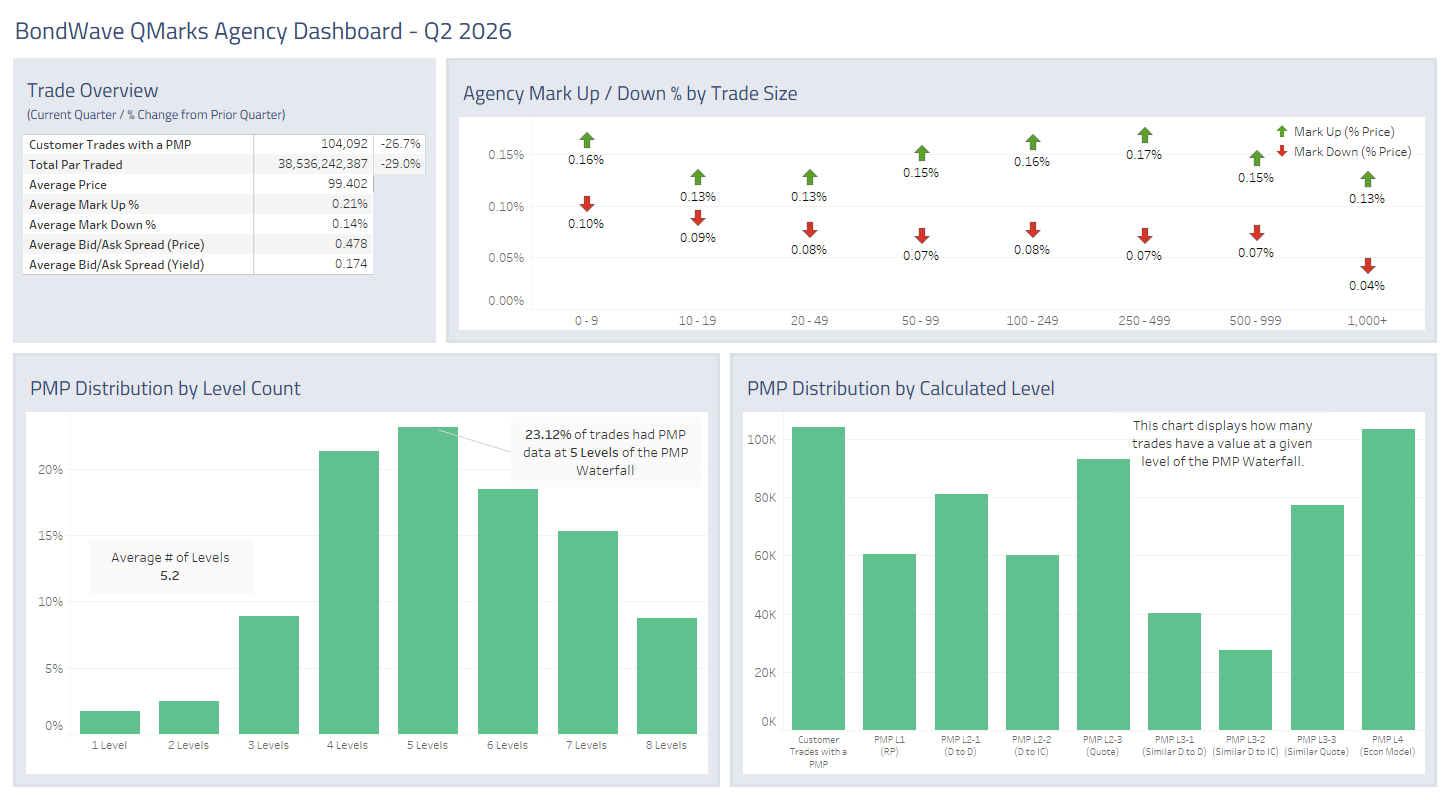
Agency trading cratered in Q2.
-
Trade counts were off 26.7%, while par traded shrank 29%.
-
Over the last seven quarters, par traded has shrunk nearly 42%.
Dashboards for the previous quarter are located here: Q1 2026 Dashboards
About BondWave LLC
Established in 2001, BondWave® is a financial technology firm specializing in fixed income solutions designed to enable clients to manage and expand their fixed income business with greater efficiency. We serve a wide range of clients, including traders, compliance professionals, RIAs, and asset managers, who use our tools to provide a superior fixed income experience to their clients while supporting critical regulatory mandates and optimizing workflows.
Effi®, our Engine for Fixed Income, is the single platform through which we deliver all our solutions – providing intuitive dashboards and insights into every fixed income position and transaction to drive informed investment and business decisions. Effi’s capabilities include Portfolio Oversight, Trade Oversight, and curated MuniNews. Our solutions are fueled by proprietary data sets that are developed using AI, machine learning technologies, and advanced data science.