Trade Insights – Volume 22
BondWave first began measuring trading costs in 2016 for US Corporate and Municipal bonds. BondWave records a fair market value for every trade disseminated by FINRA’s Trace, and MSRB’s EMMA services, using the prevailing market price (PMP) waterfall methodology codified in FINRA Rule 2121 and MSRB Rule G-30. To date that data set compromises over 1 billion observations.
With this PMP data set BondWave measures total trading cost by comparing executed prices to their PMP-derived fair values. For principal trades the difference between the execution price and the PMP represents the total trade cost. For riskless principal trades another element needs to be added to measure total cost, specifically slippage. Using these metrics, BondWave produces a total cost measurement for every trade.
One of the primary concerns with fixed income markets is the opacity and balkanization of pre-trade data relative to equity markets. Pre-trade quotes are often of low quality even when they are available, and they must be gathered from a multitude of sources at considerable expense. Additional expense of time and money needs to be spent removing duplicate observations with questionable results, at best. However, it can be argued that fixed income post-trade data quality exceeds equity market post-trade data quality in at least one key metric for anyone studying trade costs. Fixed income cost models are empirical whereas equity cost models are theoretical.
Fixed income trades mostly report to the tape at the parent trade level, whereas equity trades report at the child trade level. This means that fixed income data can be used directly without the need to make assumptions and build a model to deal with large trade sizes. While fixed income tends to have less trade data, for sizes beyond the minimum trade increment, it tends to be of higher quality.[1]
This has important implications both for measuring the cost of trades and creating trade cost benchmarks for comparison purposes. Having the total cost for every trade allows us to build benchmarks by aggregating like-trades into peer groups based solely on the characteristics of the trade and the traded instrument.
Cost Trends
Corporate Bonds
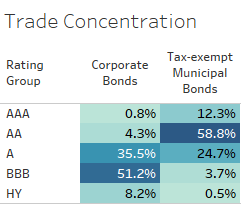
Within the corporate bond universe just over half (51.2%) of all customer trades were executed in BBB rated bonds during our study window (2017-2024). Bonds with an A rating were traded 35.5% of the time. High yield bonds comprised 8.2% of the trades. For this reason, we will focus our attention on BBB corporate bonds in the rest of this article.[2]
The distinction between riskless principal and principal trading is important when measuring trading costs as the two categories experience different types of cost as well as different levels of cost. Riskless principal trading is usually more costly than principal trading once slippage is incorporated. The distribution between riskless principal trading and principal trading varies greatly with trade sizes. Smaller trades are much more likely to be traded on a riskless principal basis than larger trades.
Calculating the mark-up on principal trades involves comparisons of execution prices to independent market data like dealer-to-dealer and institutional client trades executed by other market participants, or quotes. Riskless principal mark-ups involve comparisons to related trades. A bond is first bought from, or sold to, another dealer/customer before it is marked up or down in a related trade with a customer. As such, riskless principal mark-ups do not provide the complete cost picture. To correct this, the related trade must also be compared to independent market data. In this way slippage can be measured and added to mark-up to arrive at total cost.
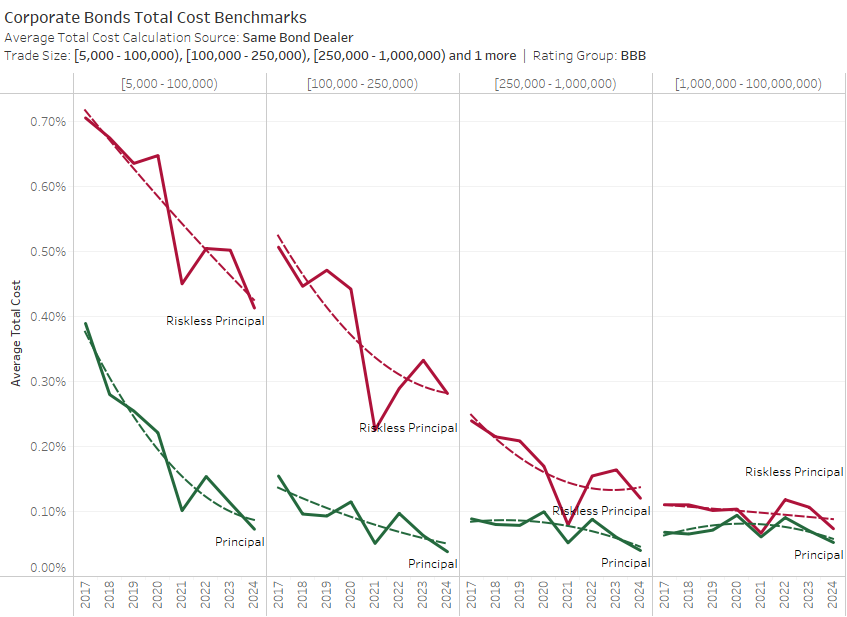
The general trend in total trading costs is downward for both principal and riskless principal trading. After several years of large incremental cost decreases, trading costs in 2024 decreased at a more moderate pace as though approaching an asymptote. The cost of smaller trades in 2024 is now on par with the cost of larger trades in prior years. In the past we have noted this trend as delivering institutional levels of cost to retail sized trades.
For the first time ever average total trading costs for principal trades for any size trade bucket were below 10 basis points. While also participating in the secular cost decline, riskless principal trading remains more costly across all categories relative to principal trading.
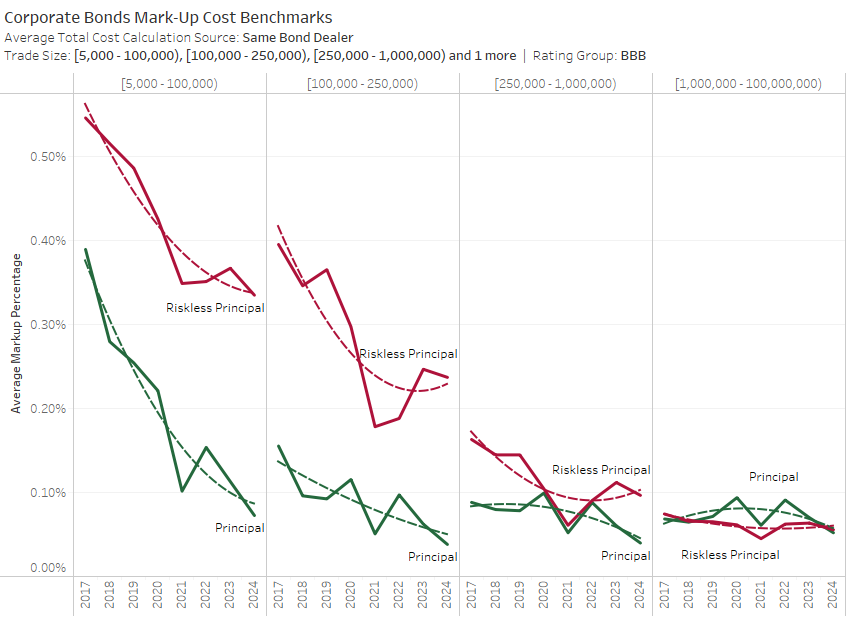
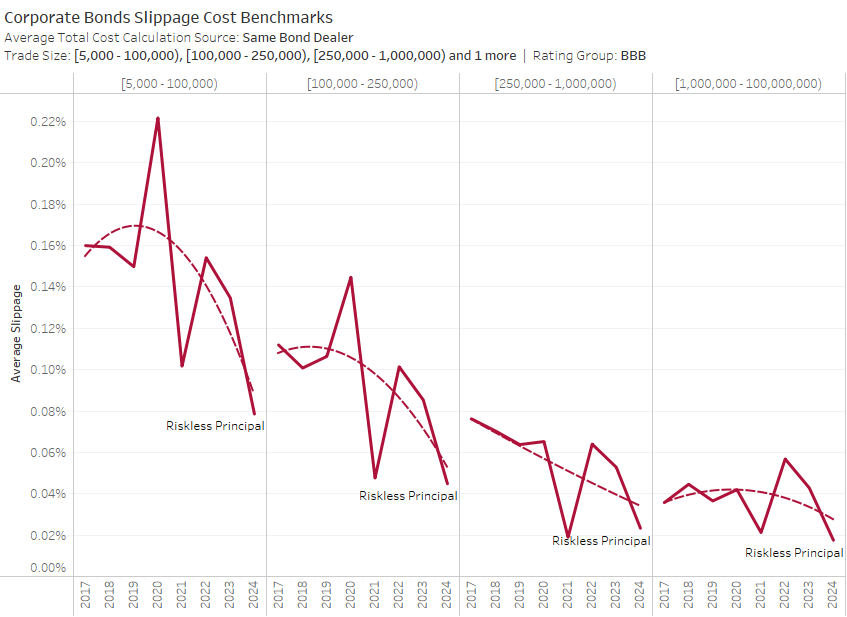
Decomposing total cost into its elements reveals mark-ups on corporate bonds have fallen significantly for all but the largest trades, which were already paying single-digit basis points for execution. Slippage on riskless principal trades, the second and hidden component of total cost discussed above, when measured against other dealer-to-dealer trades occurring in proximity, has also decreased across the board.[3]
There is no clear correlation between the decrease in trading cost and corporate bond volatility as measured using the iShares US Aggregate Bond ETF (AGG).[4],[5]
Tax-Exempt Municipal Bonds
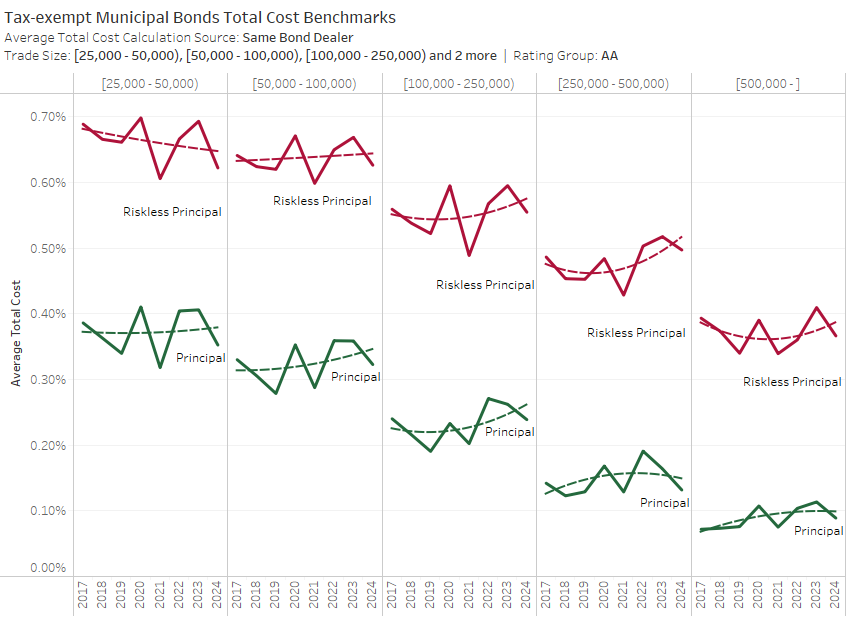
Within the tax-exempt municipal bond universe 58.8% of all customer trades were executed in AA rated bonds during our study window. Bonds with an A rating were traded 24.7% of the time. For this reason, we will focus our attention on AA municipal bonds in the rest of this article (see Trade Concentration table above).
Municipal bond total trading costs have been very volatile during our study window. While municipal bond total trading costs have generally decreased since 2022, in many cases they remain at, or above, levels seen from 2017 to 2019.
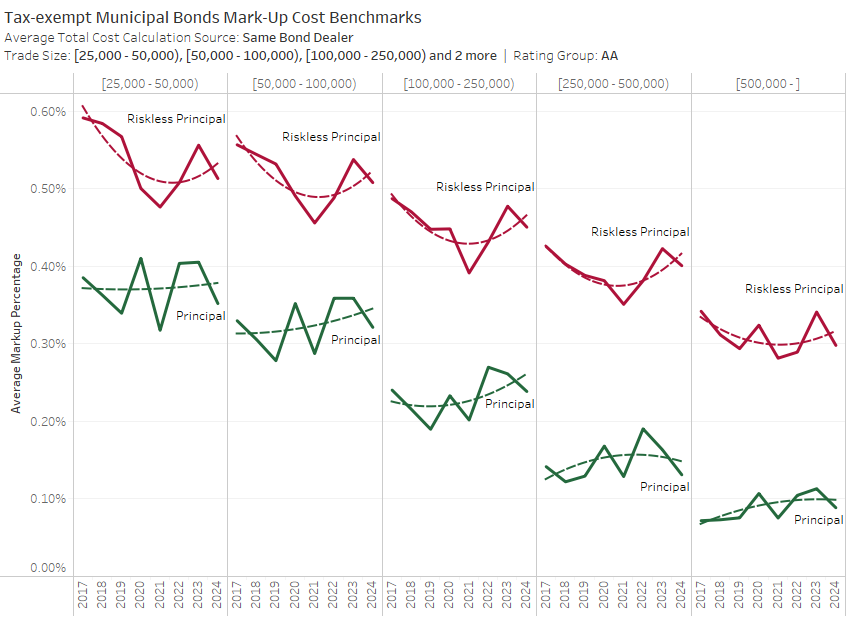
From 2017 to 2021 mark-ups on tax-exempt municipal bonds executed as riskless principal trades had declined across the board. From 2022 to 2024 that trend has mostly reversed. And while 2024 mark-ups are less than they were in 2023, they are still above 2021 levels. For principal trades the differences in mark-ups are smaller, but the trend is similar with 2024 mark-ups below 2023 levels, but still slightly above 2021 levels.
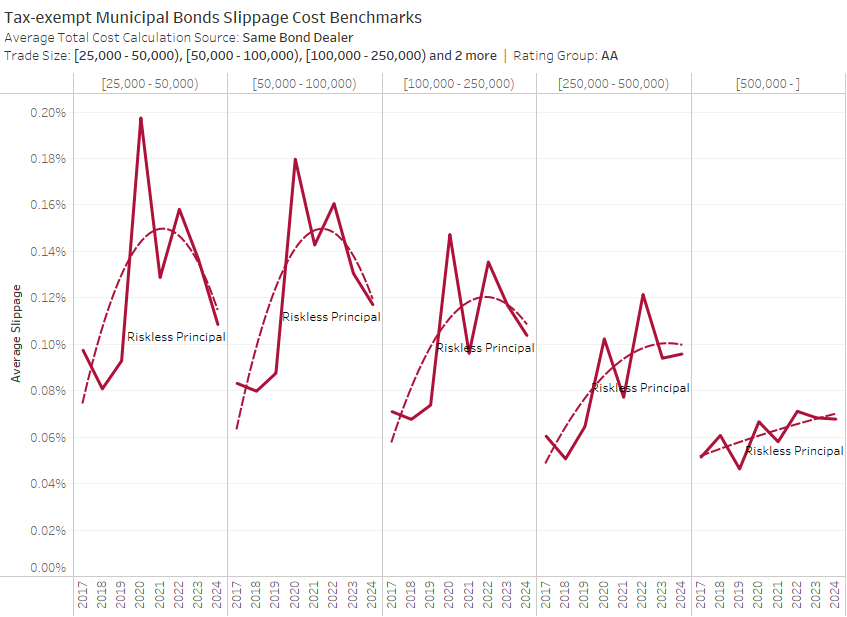
Much of the tax-exempt municipal total trade cost volatility is due to volatile slippage. Slippage doubled in the early stages of the pandemic and has yet to fully recover back to pre-pandemic levels. Still 2024 was a year of progress for slippage on all but the largest trades.
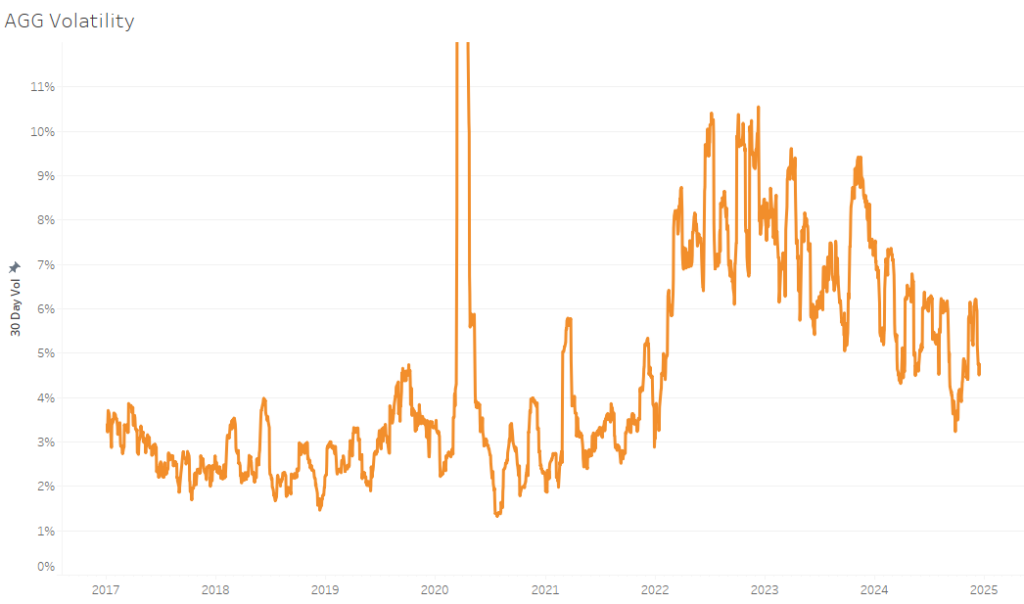
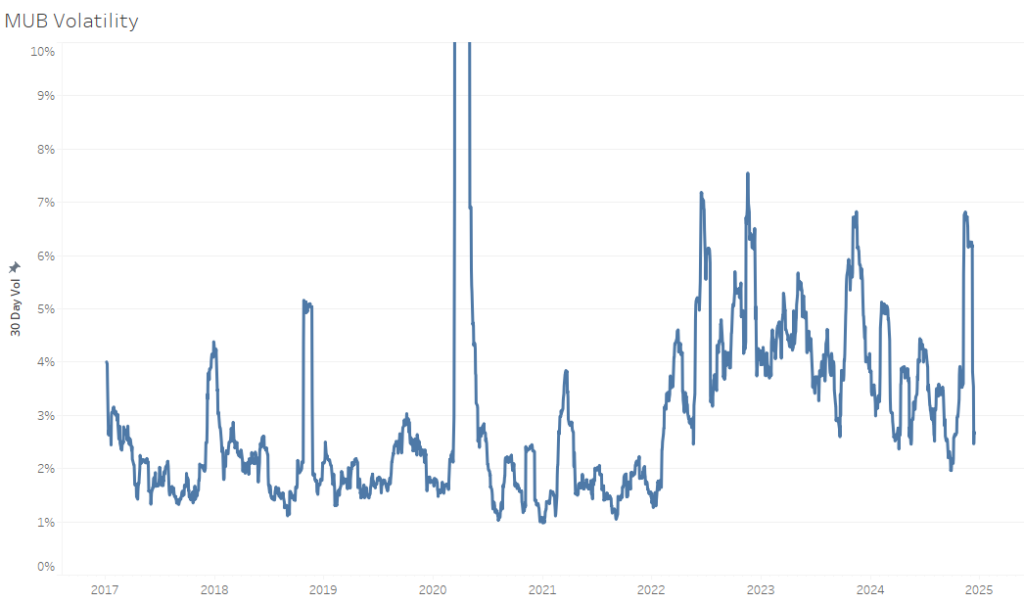
Municipal bond price volatility has remained elevated since early 2022 relative to its non-pandemic levels from 2017 to the first quarter of 2022 as measured by iShares National Muni Bond Fund ETF[6]. With the exception of a few months in 2021 municipal volatility ranged between 1% and 5% annualized. Starting around the end of the first quarter of 2022 municipal volatility between approximately 3% and 7% annualized.[7]
Volume Trends
Corp
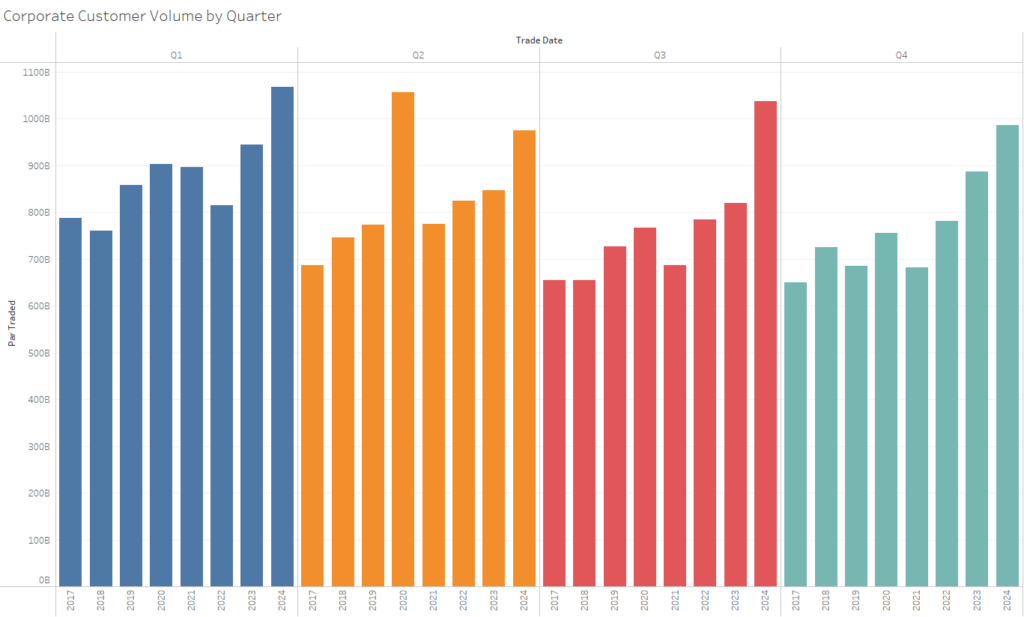
Corporate bond trading continues to grow unabated. Quarters one, three and four each saw record volume, and quarter two was only outpaced by the pandemic influenced volumes of 2020. Year-over-year gains were most impressive in the third quarter where trading jumped 26.6%. For all of 2024 US corporate bond par traded volume was 16.2% higher than 2023.
Muni
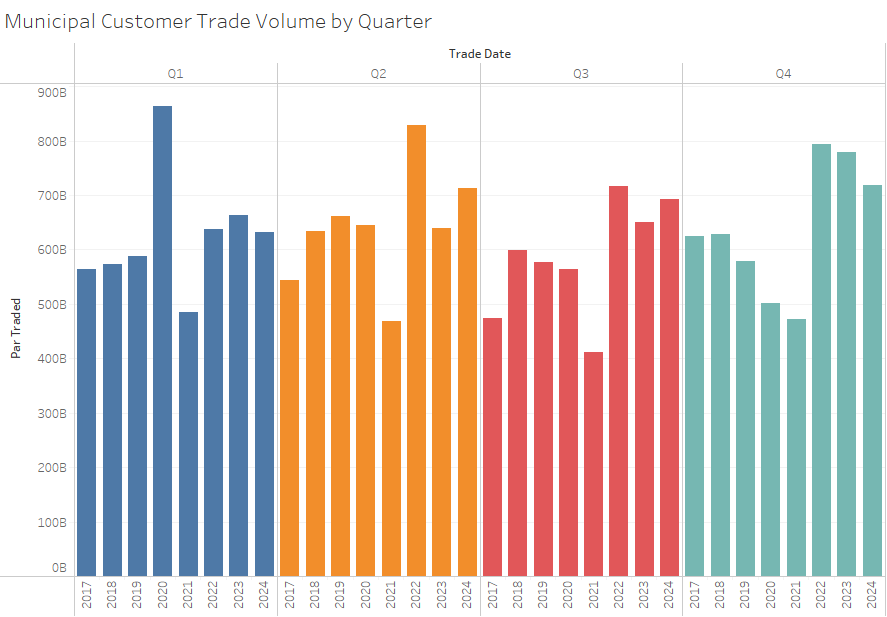
Municipal trade volume was mixed throughout the year. After a slow start in the first quarter volumes picked up in the second and third quarters only to slow again in the fourth quarter. Overall municipal volumes grew 0.64% in 2024 relative to 2023 but remained 6.6% short of 2022 levels.
Trade Cost / Market Drivers
Corp
Quantitative market making
Quantitative market making began in the equity markets. As it evolved, quantitative market makers concentrated on ways of targeting the most valuable counterparties to a market maker, retail traders. To do this it became necessary to enter into arrangements with the brokers who control the retail trading flow via payment for order flow arrangements. This is necessary because the standard form of equity trading is to use an algorithm that breaks a parent order into a multitude of child orders. Each individual child order looks very much like a retail order except that the information content of the child order is different than the information content of the retail order. In the corporate bond market, where breaking parent orders into child orders is virtually non-existent, quote size can be used to segregate market segments.
Quantitative asset management
Quantitative asset management is another innovation that began in equity markets that is now making inroads in fixed income markets. While most major fixed income asset managers offer quantitative approaches, no reliable estimate of total assets exists. The reason to expect quantitative fixed income management to grow is because the fixed income markets are in the process of providing the necessary pre-conditions with greater electronic trading, greater price transparency, and new trading protocols designed to promote more equity-like execution.
Portfolio Trading
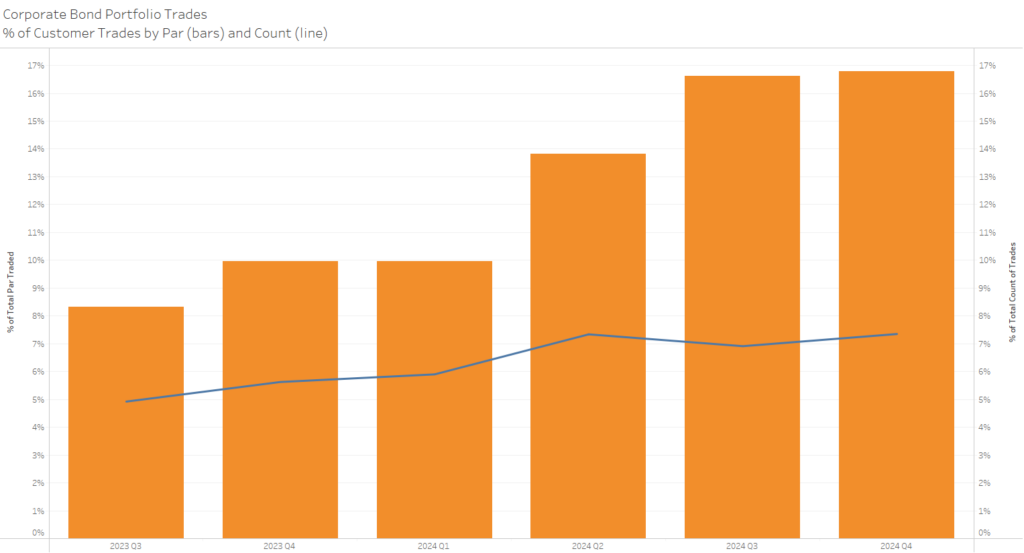
Portfolio trading has grown consistently since FINRA began flagging portfolio trades in TRACE. Since Q2 2023 portfolio trading has nearly doubled from 10.2% of par value to 18.9% of par value.[8] Studies by BondWave suggest customers who use portfolio trading see lower average total trading cost than their peers.[9]
Muni
Issuance
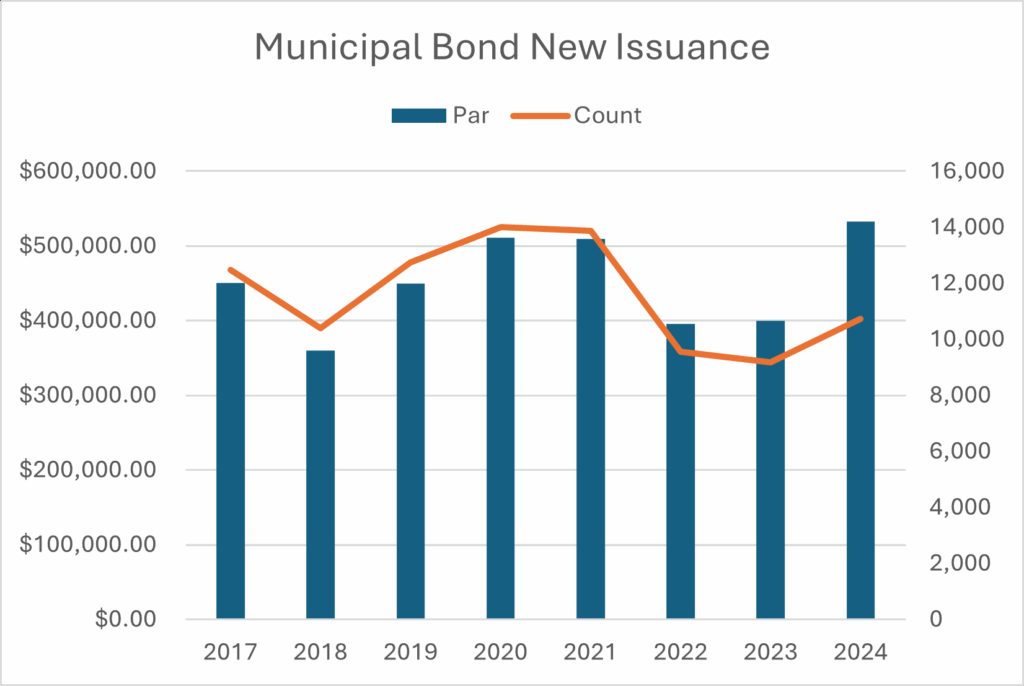
According to data from MSRB, 2024 Municipal bond issuance by par outpaced all prior years since 2017. This past year saw 16% more new issues with 33% more par value. With the tax-exemption being discussed as a possible casualty of the expected deficit reduction initiatives, the expectation is that 2025 issuance will be stronger still as issuers look to get in front of the possible change.
Quantitative market making
Quantitative market making is sizable in the municipal market, which is viewed as attractive for algorithmic pricers due to its wider bid/ask spreads. It is hard to understand these wider spreads from a credit risk perspective as municipal bonds have historically low default rates. Perhaps the wider spreads can be viewed as an illiquidity premium. Since quantitative market making firms have always excelled in the provisioning of liquidity and the management of the risks that entails, it comes as no surprise that the municipal market presents an attractive proposition.
Portfolio Trading
Municipal bond portfolio trading is best described as nascent. Portfolio trading growth in the municipal market is constrained by the difficulty of borrowing and shorting municipal bonds. This makes pricing difficult, if not impossible, for customer portfolio purchases. Despite the challenges, some portfolio trading of municipal bonds does occur. For example, MarketAxess announced their first tax-exempt municipal portfolio trade was executed in June of this year.
About BondWave LLC
Founded in 2001, BondWave® is a financial technology firm specializing in fixed income solutions. We serve a wide range of users including traders, compliance professionals, and RIAs from the smallest to the largest firms in the industry who use our tools to provide a superior fixed income experience to their clients while supporting critical regulatory mandates.
Effi®, our Engine for Fixed Income, is the single platform through which we deliver all our solutions providing intuitive dashboards and insights into every fixed income position and transaction. Capabilities include portfolio analytics and reporting, custom alerts, and proposal generation, as well as tools that support best execution, fair pricing, and mark-up monitoring and disclosure on both a pre- and post-trade basis. BondWave leverages advanced technologies and data science to develop proprietary data sets that fuel our innovative solutions.
This material has been prepared by BondWave LLC (BondWave) and reflects the current opinion of the authors. It is based on sources and data believed to be accurate and reliable but has not been independently verified by BondWave. Opinions and forward looking statements are subject to change without notice. The material does not constitute a research report or advice and any securities referenced are for illustrative purposes only and not a recommendation to buy or sell any security.
[1] Other important distinguishing qualities of fixed income trade dissemination is that for many asset classes the type of counterparty and the side of market for customer trades is disclosed. This is useful for defining peer groups.
[2] BondWave produces transaction quality benchmark for all ratings categories. For more information on other rating categories contact BondWave at info@bondwave.com.
[3] Not all slippage can be measured against other dealer-to-dealer trades. BondWave maintains separate peer indexes for each data source when measuring slippage: dealer-to-dealer trades, institutional customers trades, quotes, similar bond activity and an economic model. Contact BondWave at info@bondwave.com for further details about peer benchmark construction.
[4] While not shown on the graph, AGG 30-day volatility peaked at 27.96% on March 27, 2020.
[5] Using an index or ETF when calculating volatility fails to account for correlation variances through time.
[6] While not shown on the graph, MUB 30-day volatility peaked at 40.48% on 4/6/2020.
[7] Using an index or ETF when calculating volatility fails to account for correlation variances through time.
[8] These estimates are impacted by another TRACE dissemination policy. TRACE caps the par sizes of high yield bonds at $1 million and investment grade bonds at $5 million. In Q3 2023, 2% of portfolio trades and 3% of non-portfolio trades were impacted by the caps. In Q4 2024, 2.8% of portfolio trades and 2.8% of non-portfolio trades were impacted by the caps.
[9] Corporate Bond Portfolio Trading Examined (Trade Insight – Volume 19), BondWave August 9, 2023, https://bondwave.com/corporate-bond-portfolio-trading
