Municipal Bond Trading Patterns During the Pandemic
In speaking with traders, a common refrain the past two weeks is that there are just no bids available for municipal bonds. It does not matter if they are looking to trade in small sizes either. Examining municipal bond trading patterns reveals a possible explanation for this condition.
Source: MSRB, BondWave
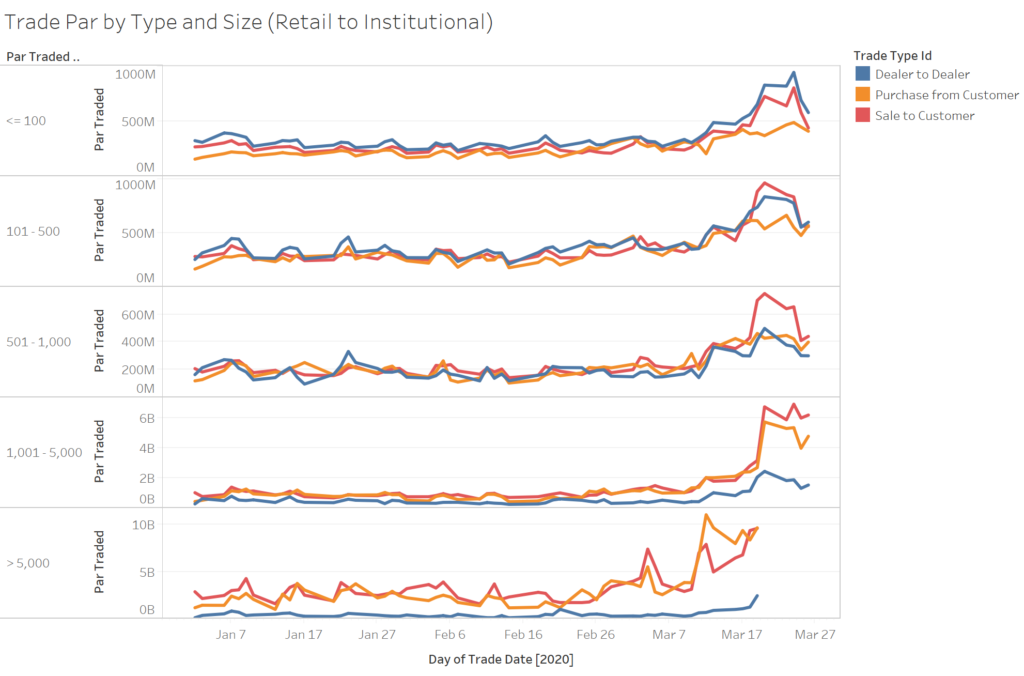
In the above graph BondWave has broken out EMMA trade reports by trade size buckets, then aggregated par volume by trade type chronologically within those buckets.
What is immediately clear is that large institutional selling of municipal bonds began a week before selling in other size categories. Dealing with the resulting inventory backlog goes a long way toward explaining the lack of bids that are being reported.
Source: MSRB, BondWave
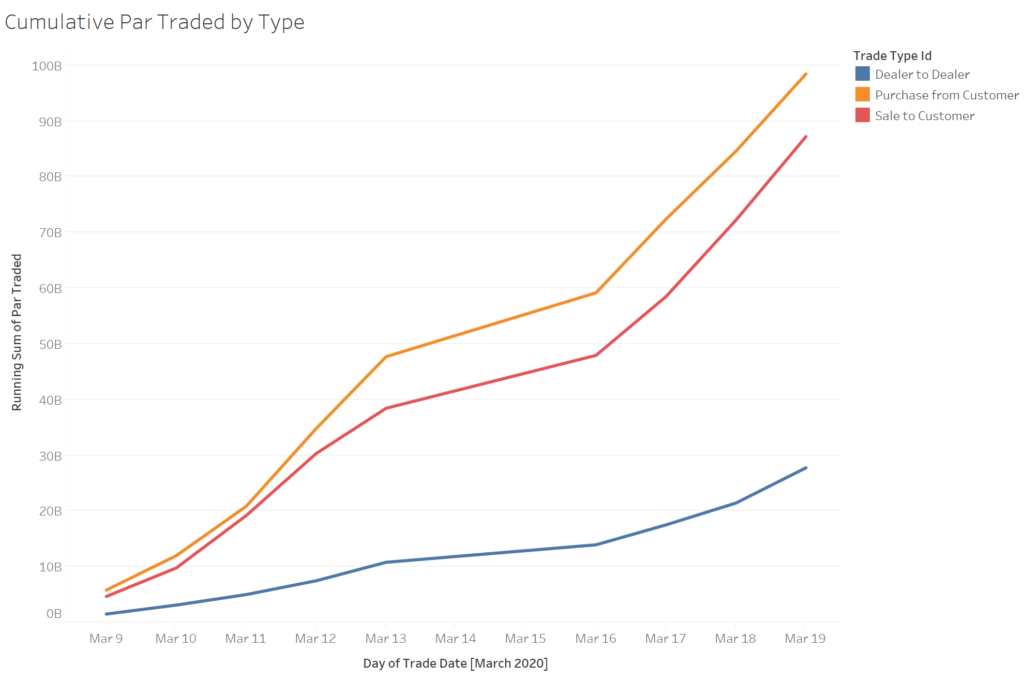
The cumulative amount traded by type shows that as of 3/19/2020 the imbalance was still growing. This data and the > $5 million category in the first set of graphs ends with 3/19/2020 because the MSRB disseminates true trade sizes for investment grade bond trades that are greater than $5 million and high yield bond trades that are greater than $1 million after a week.
