Is it time to start including “odd lot” trades in evaluated prices?
Evaluated prices for fixed income securities are relied upon for a variety of uses. Brokers and custodians use them to generate statement values for their customers. ETFs use them to calculate NAVs. Portfolio managers use them to choose bonds for their portfolios. Every part of the fixed income investing ecosystem relies on evaluated prices.
For this reason, it is critical that these evaluations are generally accurate. And they are generally accurate. Evaluators have built processes to allow their clients to provide them with near instant feedback when they feel an individual evaluation is incorrect. These processes go a long way to ensuring consensus and accuracy. For what is accuracy when it comes to the value of financial assets, other than a consensus? In the equity world this consensus is built through trading. Nearly every stock in the United States trades nearly every day the market is open (and some trade even while the market is closed). The consensus opinion of two people willing to transact at a price is how we value the equity component of the capital structure.
We tend to ignore that this is a marginal approach to valuation. It is generally a very accurate way to value the next 100 shares of stock that someone wants to trade. But we also use it to make statements about the total equity value of a company. We say that the market capitalization of a company is the shares outstanding multiplied by the price of the last tiny increment of stock to trade. However, if we were to offer to buy the entire company (i.e. a tender offer) we would have to pay a premium to that last tiny increment that traded. As a matter of fact, even if we were interested in a tiny fraction of a company, but one that was a substantial multiple of the tiny fractions that typically trade (i.e. a block trade), we would have to pay a premium over the price of the last tiny increment.
But, since the predominance of shares, and aggregate value, trade in these tiny increments we tend to ignore the prices for block trades and tender offers. We treat them as outliers and relatively uninformative when discussing the value of investments, or the market taken as a whole.
The Case Against Odd Lots
The opposite is true in the fixed income market. In the fixed income market, the smaller trades are generally ignored when valuing a bond. Only the larger trades factor into the bond evaluation process. The cut off for larger trades is generally $1 million par. In the municipal market only 5% of secondary trades in 2020 were for at least that size. In corporate bonds the total is approximately 11%. Of course, those 5% of trades in munis and 11% of trades in corporates represent over 80% and 74% of the traded value, respectively. And that has always been part of the argument against using smaller trade sizes in calculating evaluated prices. Why use tiny trades when in aggregate they typically represent less than 25% of the traded value in the market?
The other argument for not using small trades centers around what is embedded in reported trades for fixed income securities. Specifically, there is a substantive difference between equities and fixed income trade reporting when it comes to commissions (or mark-ups, in bond parlance). A simplified way to think about it is, equity trades are reported to the tape exclusive of broker compensation while fixed income trades are reported inclusive of broker compensation. Since a portion of the broker compensation is to cover the fixed costs of trading and settling trades, the embedded compensation appears to be somewhat regressive. Smaller trades have higher embedded compensation as a percentage of the price. This creates a situation where there appear to be two different markets. One for large trades where prices are tighter (i.e. bid side trades are closer in price to offer side trades) and a different, wider one for small trades. Therefore, using these smaller trades with wider prices would result in potential skews to the evaluated price process with its goal of attaining a “fair value”.
In normal times, using only 5% of the available data to determine the “fair value” of a municipal bond is generally fine. But we all know these are not normal times. “Unprecedented” as a Google search term has reached… unprecedented levels.
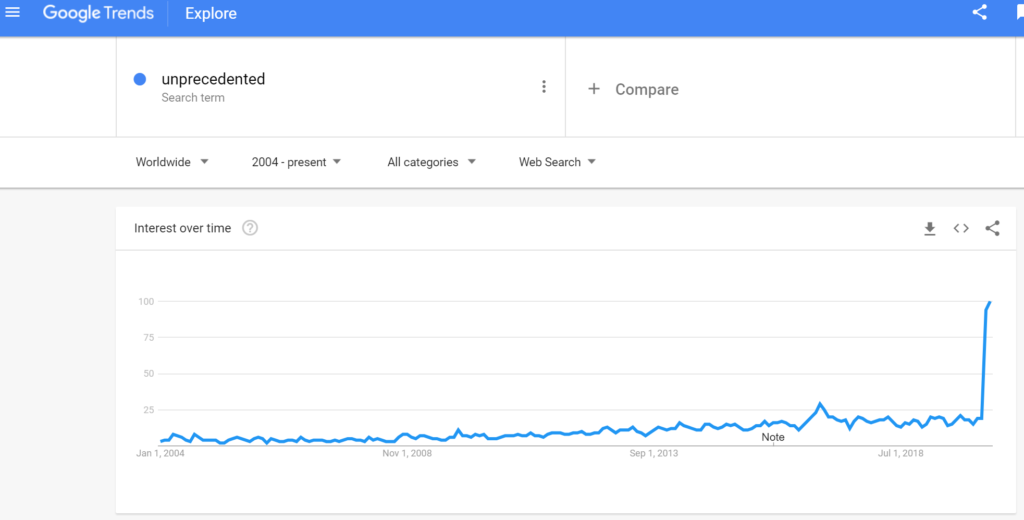
Source: Google
The Case for Odd Lots
Not factoring in 95% of available pricing data also makes sense if that data is systematically skewed. But an interesting thing has happened in the past two years. FINRA and the MSRB have instituted rules for disclosing to their retail clients the amount of compensation earned by brokers. Along with that mandate came a prescribed process that the industry is to use to calculate that compensation. The Mark-Up Disclosure Rule now makes it possible to calculate, and more importantly, extract the compensation embedded in reported fixed income prices such that a price closer to the “fair value” can be attained for every trade, large or small.
For every trade reported to FINRA (registered corporate bonds, 144a bonds, and agency bonds) and EMMA (municipal bonds) BondWave calculates the prevailing market price up to 8 different ways. Using this data, we can extract the mark up from a transaction to determine what the “fair value” of a bond is prior to the addition of broker compensation. Using this method, we can effectively take the odd lot trades on the tape and put them on an equal footing to the large trades. We can even extract the compensation component from the large trades and put them on an equal footing with dealer-to-dealer trades, that presumably only have an embedded bid-ask spread.
This may seem unnecessary until we examine the current relationship between evaluated prices and trade prices. Beginning in early March when fixed income markets became unusually volatile in response to the shutdown of the economy due to the spread of COVID-19 we see a pronounced dislocation between evaluated prices and trade prices (in the municipal market in particular).
To measure this, we calculated the percentage difference between each trade price and its same day evaluated price, normalized for side, and averaged across all CUSIPs in the four asset types covered by the Mark-Up Disclosure Rule (municipals, corporates, 144a, and agencies).
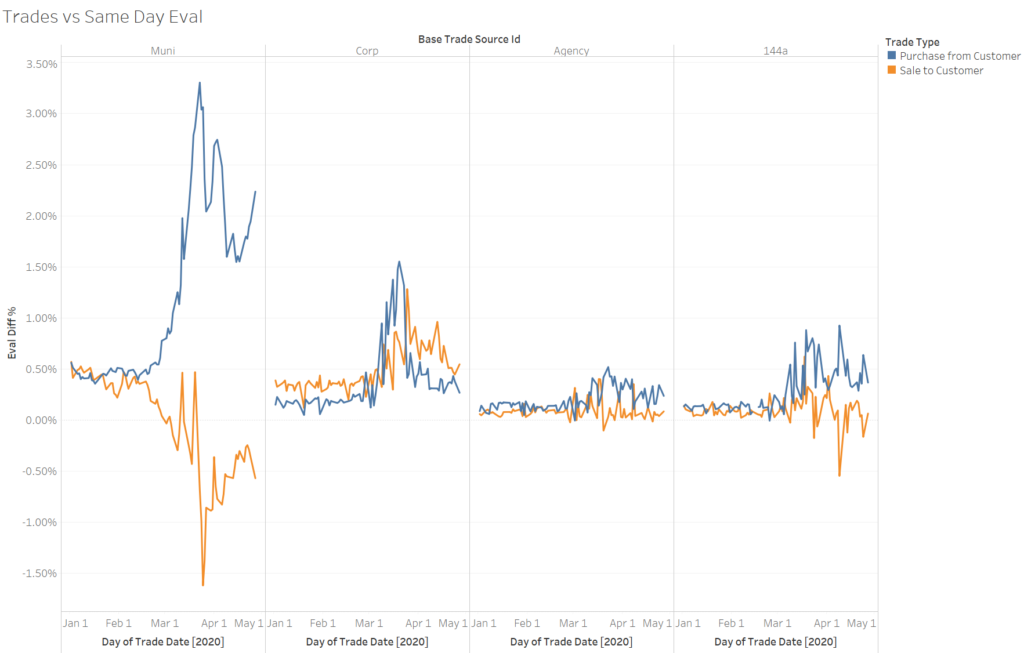
Source: BondWave LLC Universal PMP data
Beginning in early March and continuing to the present, sales to customers (offer side trades) have occurred at a discount to the evaluated prices. At the same time purchases from customers (bid side trades), which normally trade at a slight premium, began to trade at a large premium. Effectively, this implies that mark-ups, relative to evaluated prices, became negative for the offer and very large for the bid. The only way for this to happen is if the evaluated prices are above both the bid and the offer prices.
In a fast market, using only 5% of available trades risks using stale data. And it appears that municipal evaluated prices have failed to keep pace with average trading activity. This helps to explain the recent phenomena where ETFs began to trade at a discount to their NAV. The NAVs are at least partially dependent on evaluated prices. This is perhaps most true for the Van Eck Vectors Muni High Yield Index ETF (Ticker: HYD) which made headlines in March when it traded at discounts to its NAV of as much as 19%. Given that fewer than 10% of the bonds in HYD trade on a given day, it’s NAV is highly dependent on evaluated prices. And as we see above, the evaluated prices did not keep pace with the bonds that had trades, making it highly unlikely that they were able to keep pace with bonds that did not trade.
Conclusion
Evaluated prices have avoided using odd lot trade sizes because of the problems inherent in using them (high embedded fixed costs, premium pricing associated with small trades), but with recent advancements in statistical methods for adjusting prices to remove these problems combined with increased volatility in fixed income markets, it seems the time is upon us to re-evaluate the use of smaller trade sizes. This is especially true for the municipal market where it is estimated by the Federal Reserve Board that at the end of 2018 the majority of bonds were held by households and non-profit organizations (they do not break this category down further). ETF creation/redemption activity creates the need for dealers to trade more diversified baskets with smaller average trade sizes. The growth of portfolio trading in fixed income is also likely to push average trade sizes lower even for institutional traders. These trends will feed the usefulness of small trades in the evaluation process.
