The Muni/Treasury Ratio Inverts
The municipal bond market has not remained immune to the reaction of equity markets to the recent COVID-19 virus pandemic. Municipal bond yields have responded rapidly to the economic and trading activity, emergency aid and the Federal rate cut of March 15th. BondWave’s AA QCurve captures intraday trading activity of AA rated municipal securities representing more than 49% of trade volume on any given day.
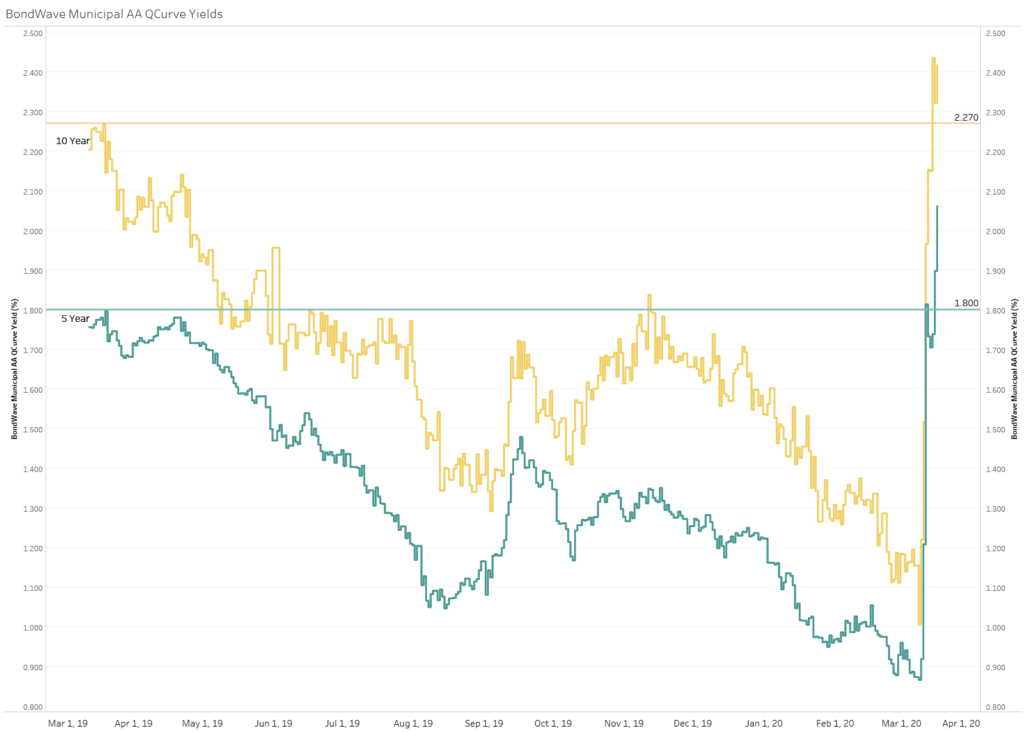
Muni Yields Jump
This past week has seen a sudden rise in municipal bond yields back to their levels observed around this time in 2019. The 5-year point on the BondWave AA QCurve Yield stood at 2.06% at the close of March 17th, while the 10-year was at 2.42%.
Source: BondWave
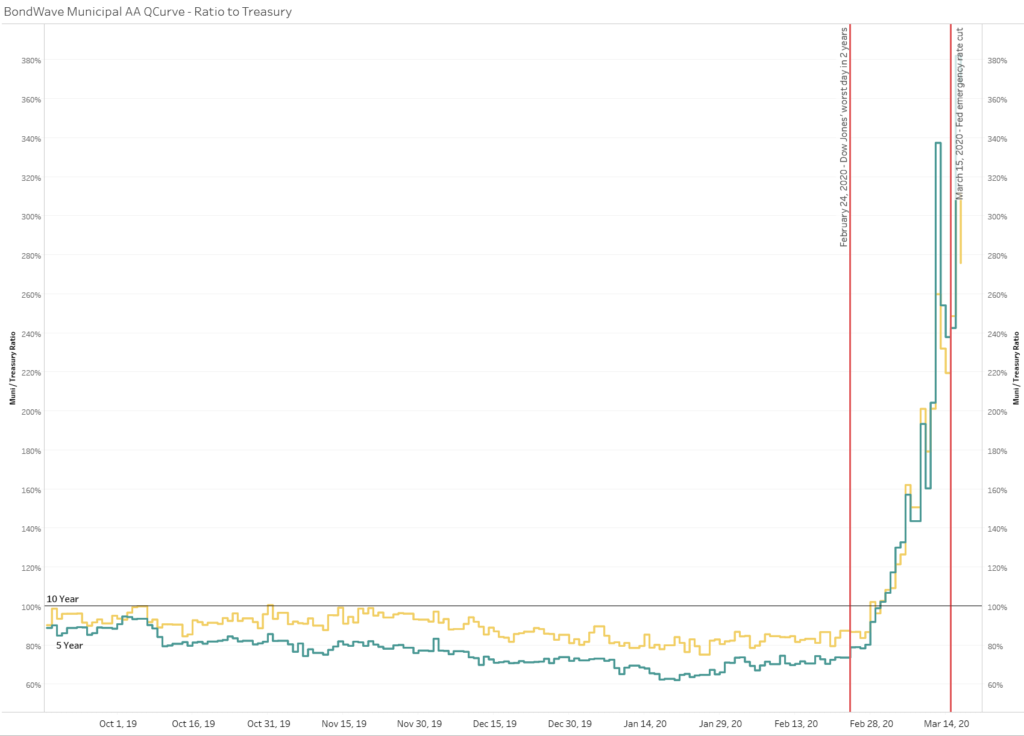
Muni/Treasury Yield Ratio Inverts
Municipal bond yields generally trade at a discount to their Treasury counterparts. Historically, the Muni/Treasury yield ratio has been a popular measure to assess the relative value of municipal bonds. Over the past week, this ratio has seen an abrupt jump from its long-term average of approximately 90% to levels not seen in the past two years. The relationship between Municipal and Treasury bonds has inverted as Treasuries experienced flight to safety and municipal bond prices have moved sharply lower causing yields to move higher. The 5-year Muni/Treasury ratio ended March 17th at 368% (QCurve Yield at 2.06% and Treasury at 0.56%) and the 10-year Muni/Treasury ratio at 276% (QCurve Yield at 2.42% and Treasury at 0.88%).
Source: BondWave
