Developed to help bond market participants better understand trading trends in the fixed income markets, BondWave’s Data Lab has released its QMarksTM dashboards for the first quarter of 2022.
Formerly known as Universal Prevailing Market Price (UPMP), QMarks is a proprietary BondWave data set that powers its quarterly dashboards to cover all disseminated bond transactions using the regulatory-prescribed Prevailing Market Price methodology for corporate, municipal, agency, and 144A. It joins a suite of other BondWave proprietary data sets, including QCurves, QTrades, and QScores.
Q1 2022 Observations: Fixed Income Trade Counts Rise in Q1
“Both the corporate & 144A asset classes saw increases hovering around 20% for total par traded in BondWave’s QMarks Q1 2022 dashboards vs. Q4 2021. Mark ups remained fairly flat across all four asset classes. Meanwhile, year-over-year volume for munis grew 42%, but the other asset classes saw decreases in volume between 9% and 29%.” – Paul Daley, Managing Director
Corporate Bond Market Trends
Observations:
- Similar to Q1 of 2021, corporate trading volume had a strong start in 2022, up 20.45% from Q4 2021. However, total par traded is still down year-over-year, $858 billion compared to $948 billion in Q1 2021.
- The number of customer trades with a PMP increased nearly 22% from the previous quarter.
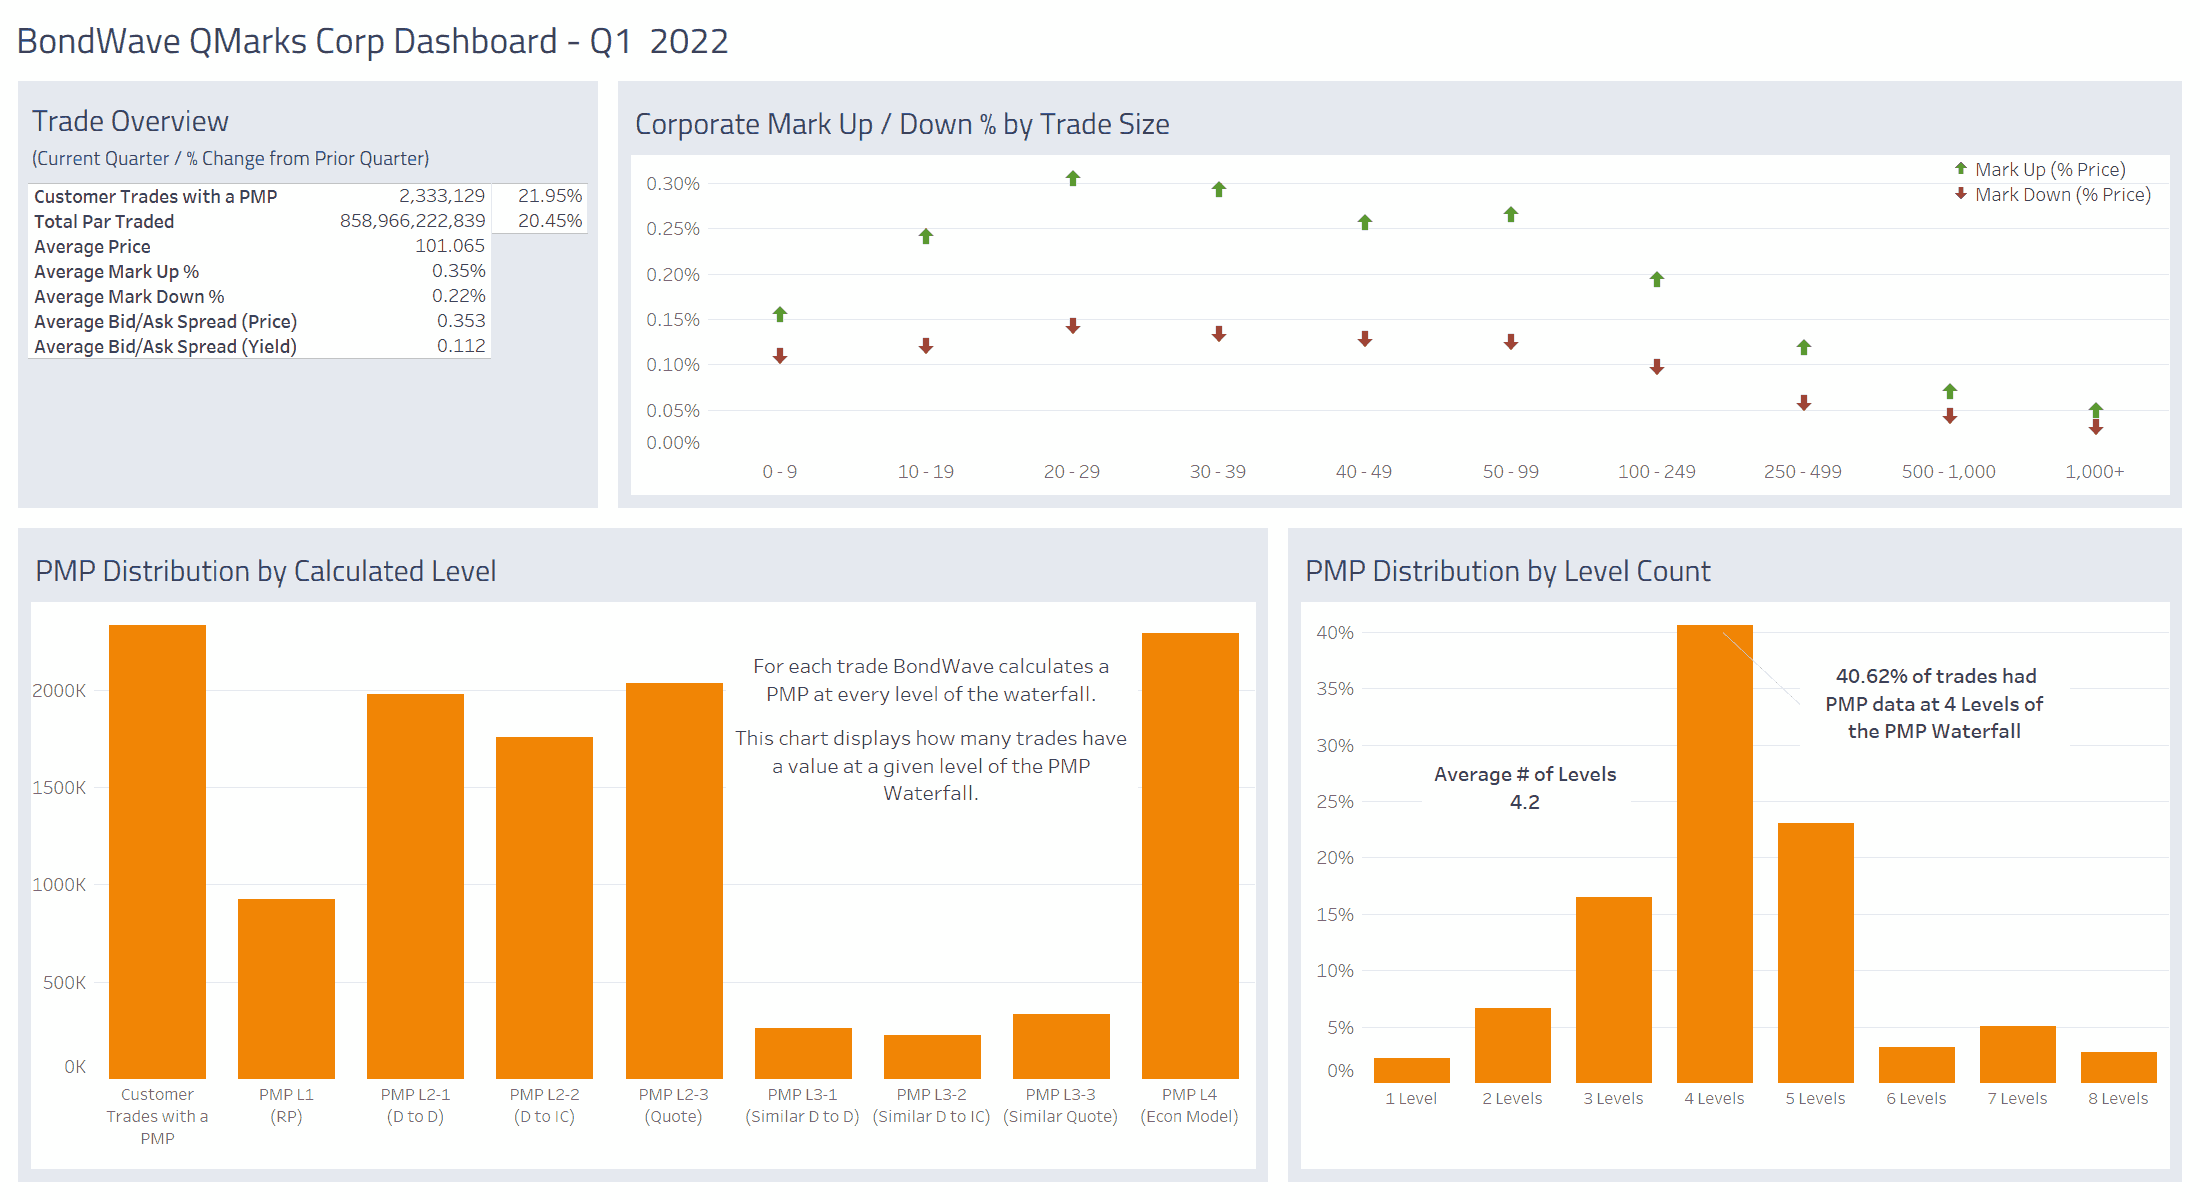
Source: BondWave QMarks
Municipal Bond Market Trends
Observations:
- Municipal trading volume had the strongest start in Q1 with a 38.74% increase over the previous quarter.
- The number of customer trades with a PMP increased nearly 29% from the previous quarter.
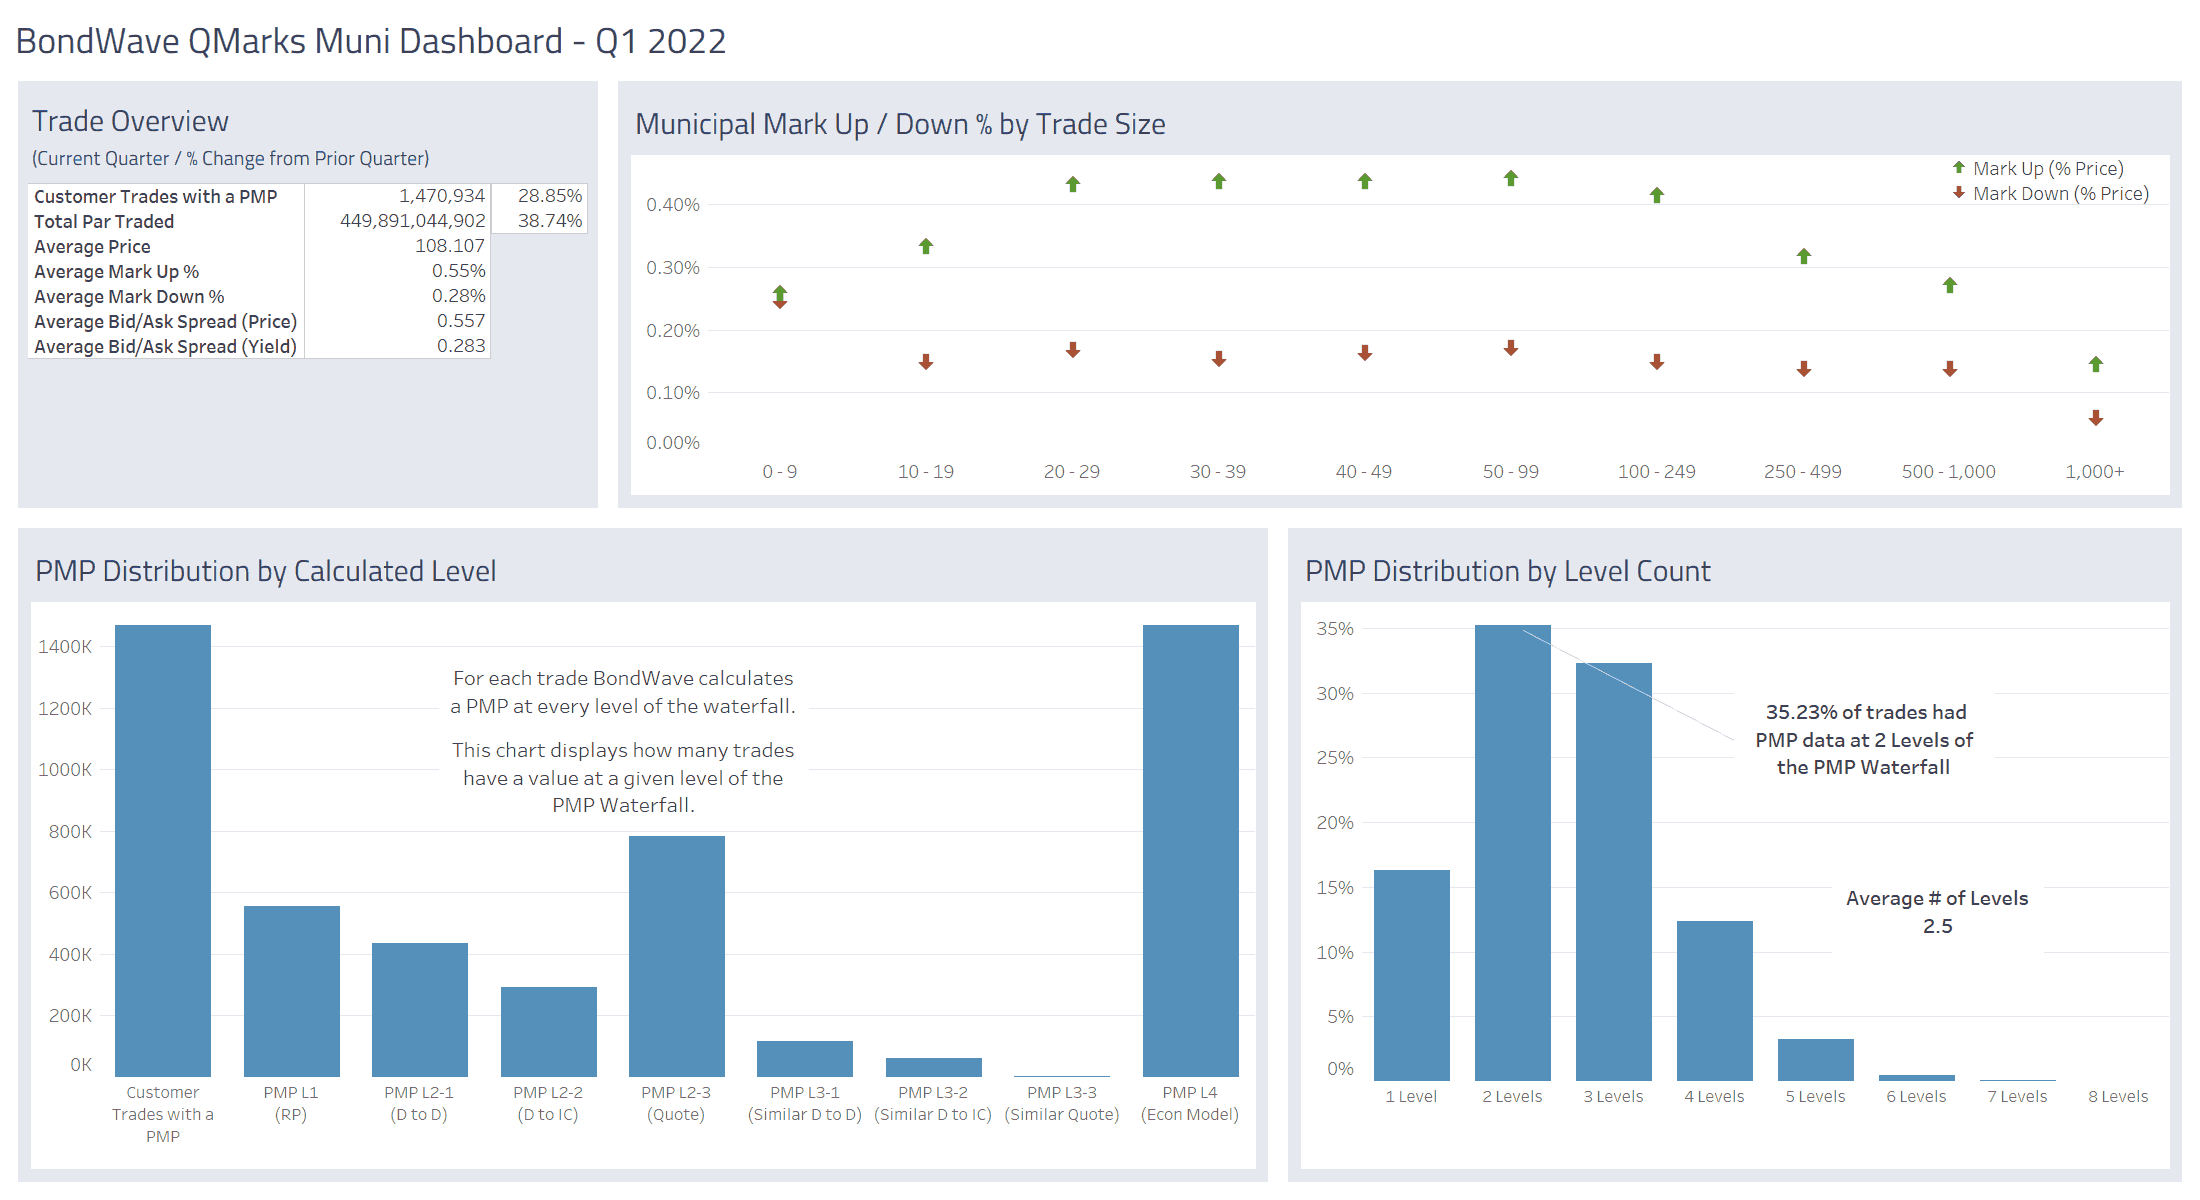
Source: BondWave QMarks
Agency Bond Market Trends
Observations:
- Agency bond customer trading exceeded $53 billion in the first quarter. While a slight increase from the previous quarter, still far from the $75 billion in the first quarter of 2021.
- The weighted average number of levels of the waterfall with data returned to 4.4 after being 4.6 in Q4 2021.
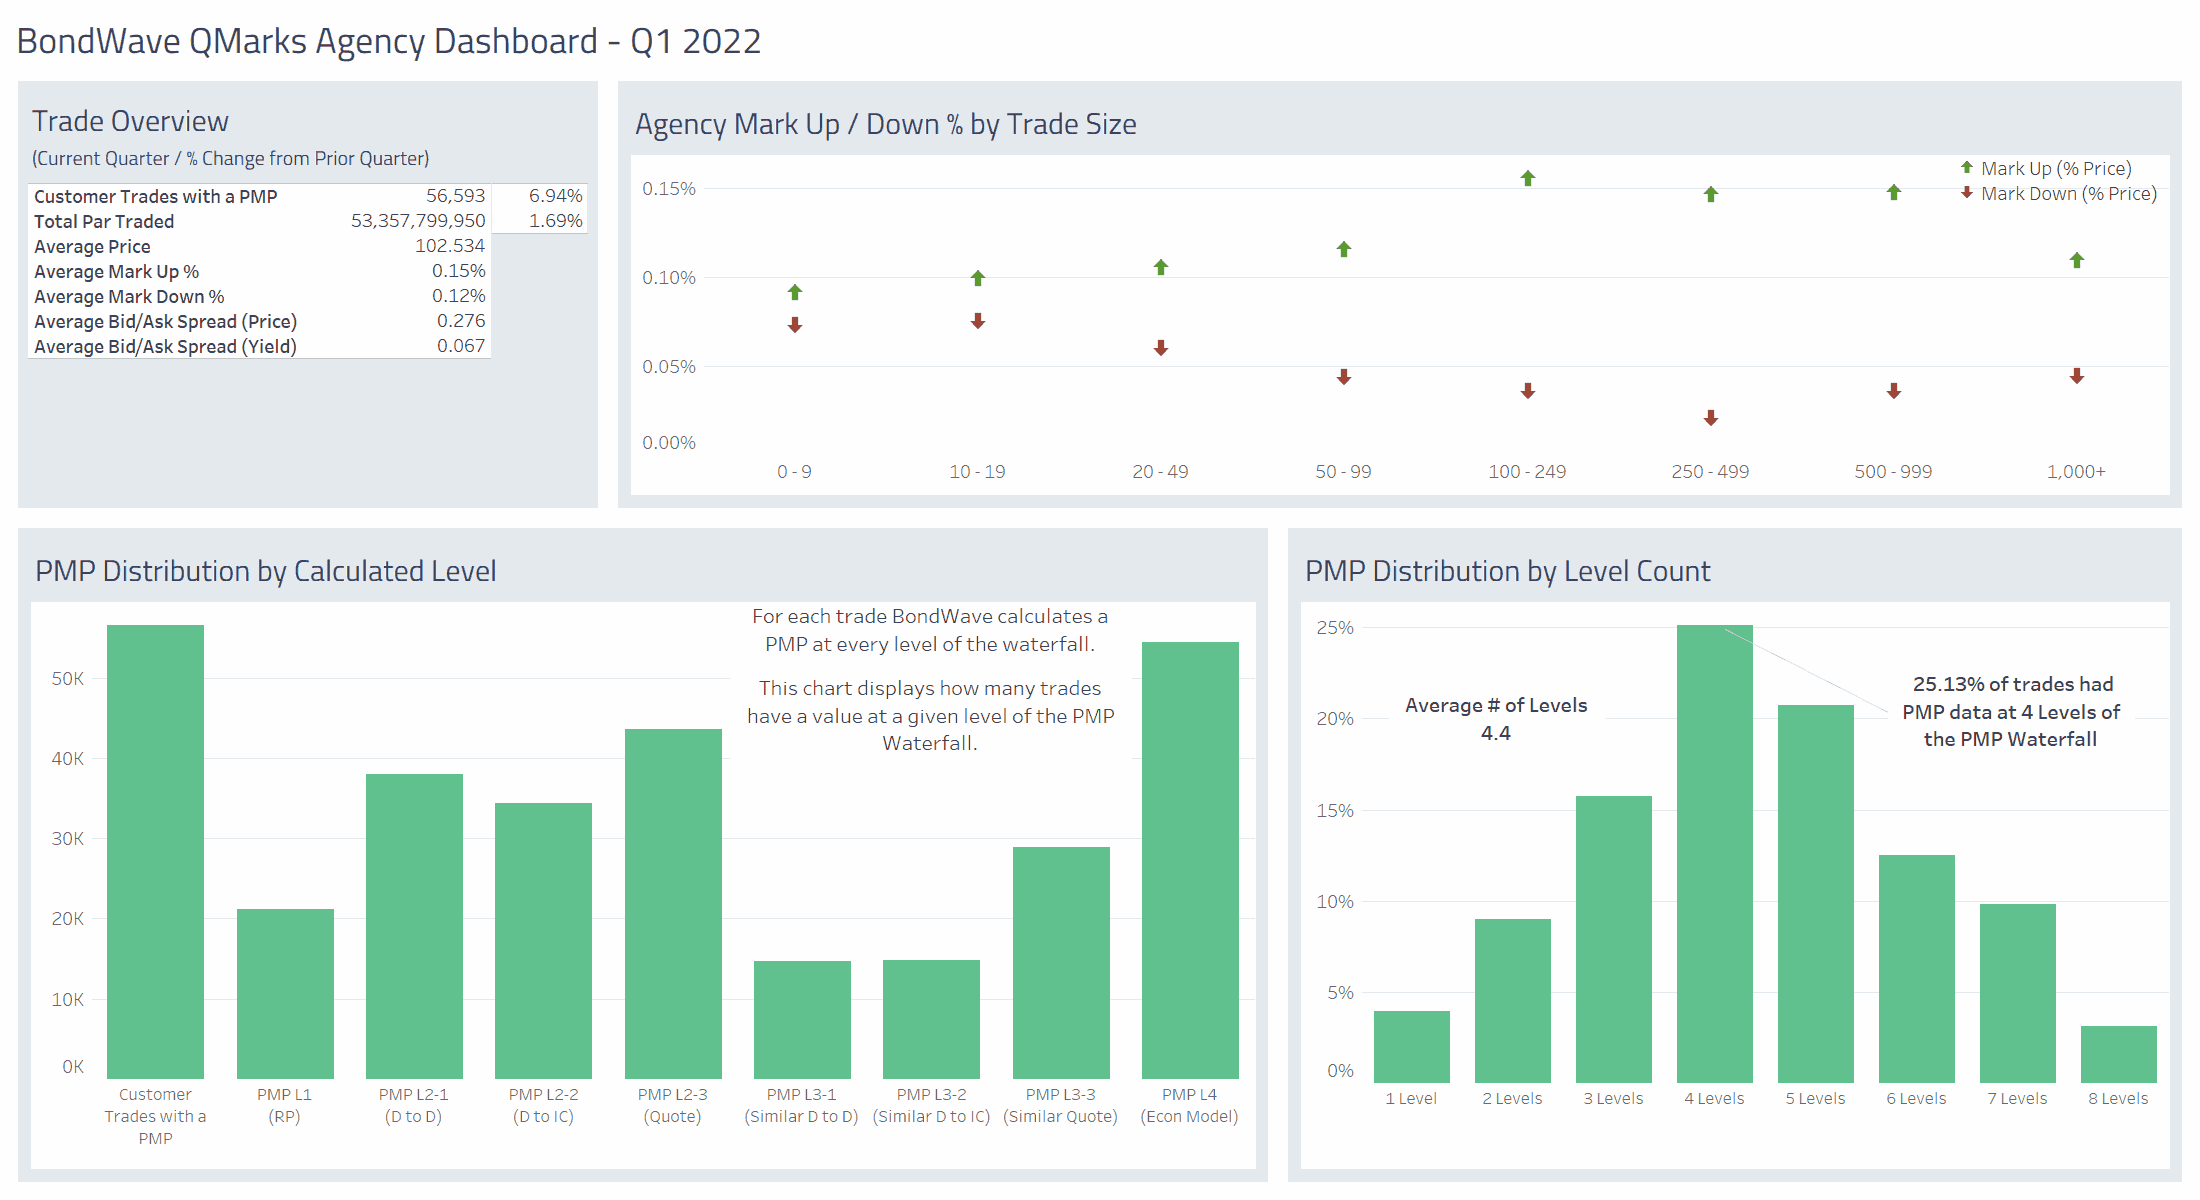
Source: BondWave QMarks
144A Bond Market Trends
Observations:
- 144A bond customer trading had a strong start, as it did in Q1 2021. However, even with a 19.86% increase from the previous quarter total par traded is still down year-over-year at $274 billion compared to $297 billion in Q1 2021.
- Bid/Ask spreads remained stable in the first quarter as it did in the two previous quarters.
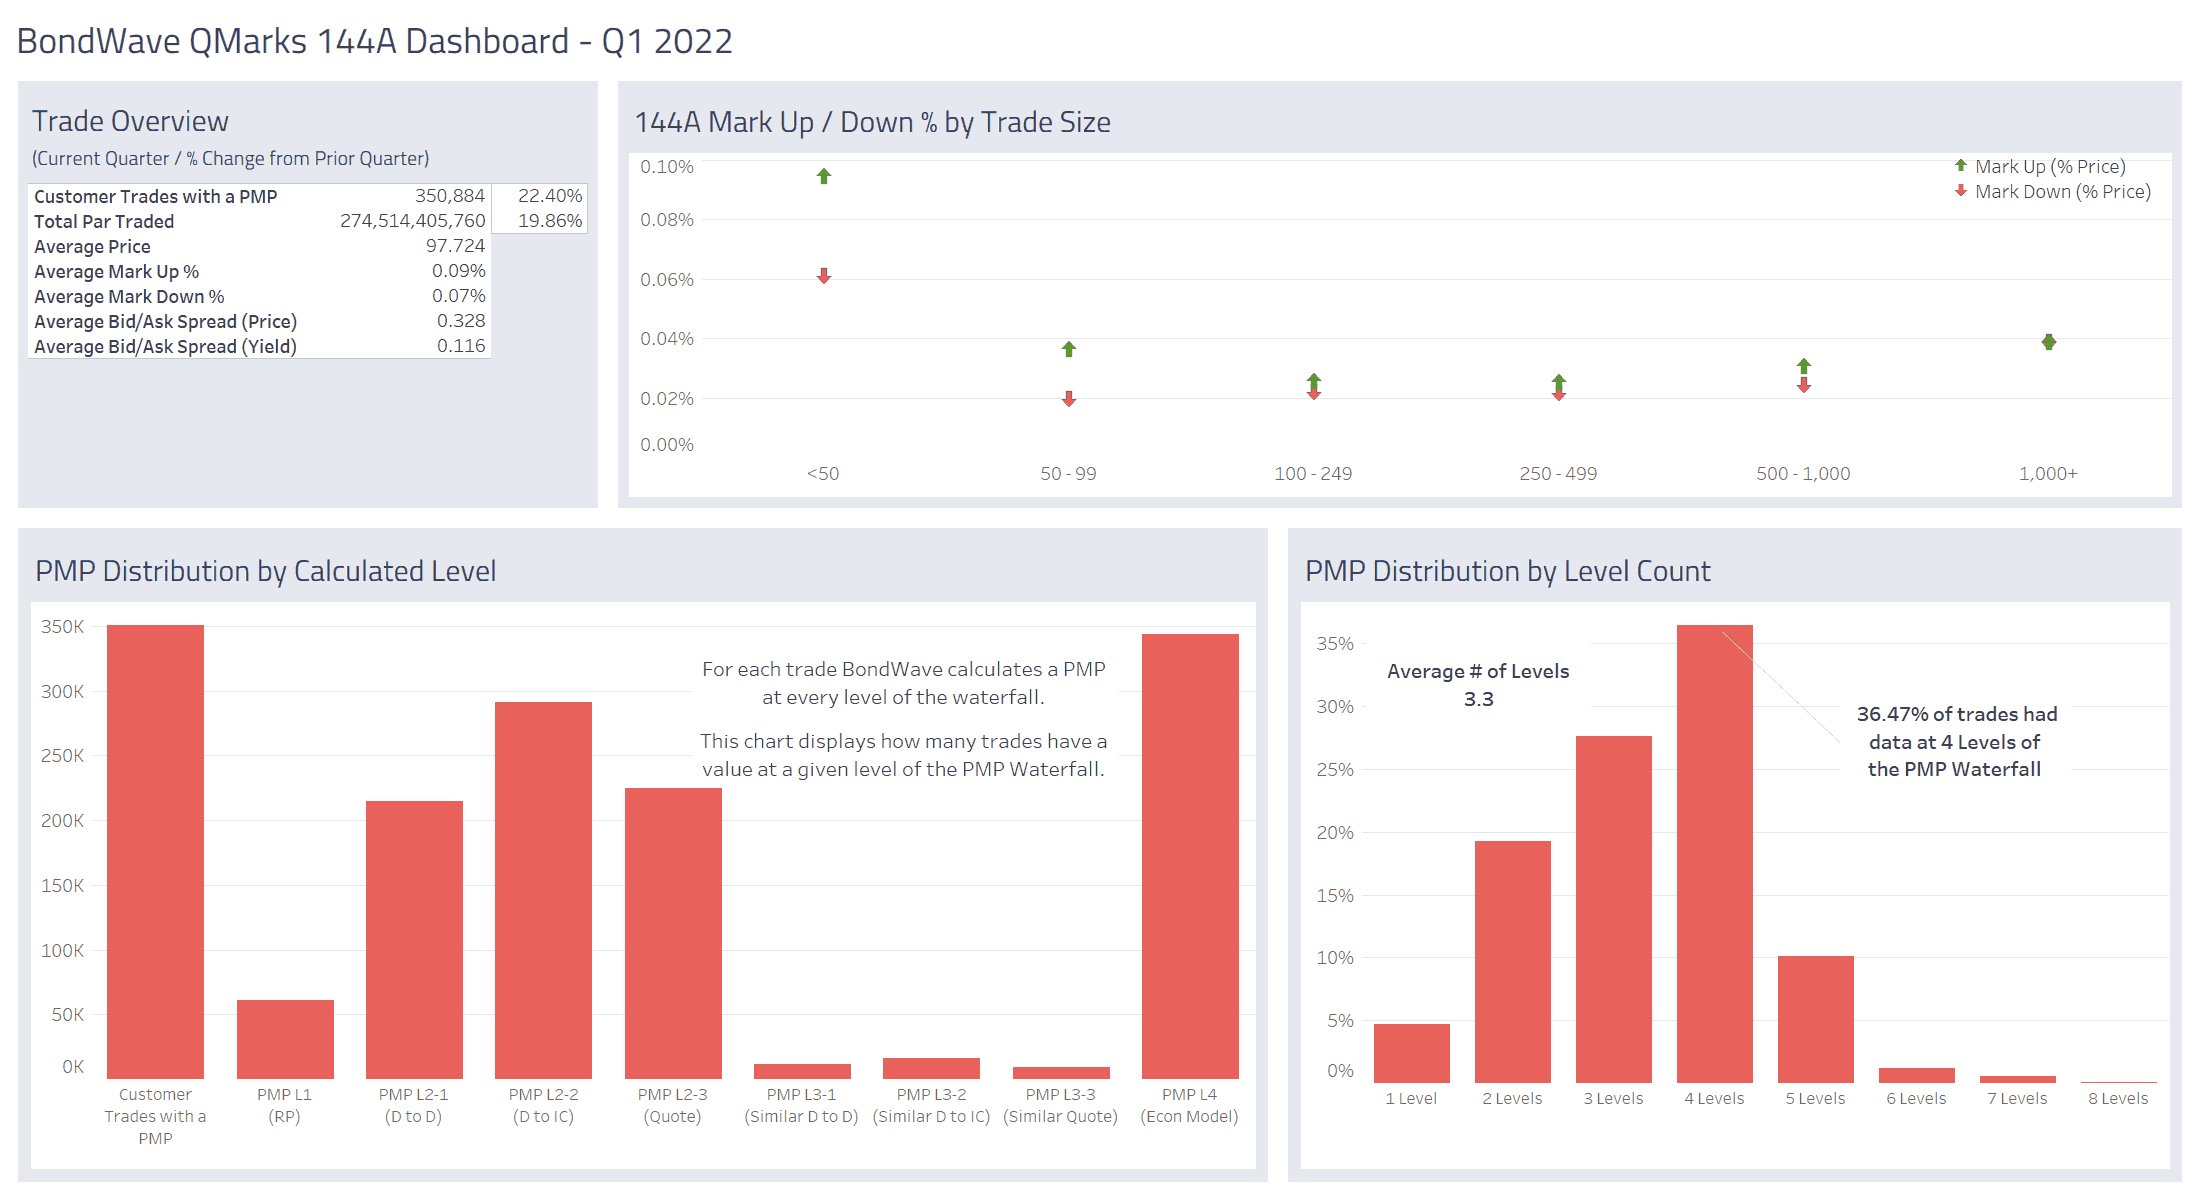
Source: BondWave QMarks
