The Role of Slippage in Fixed Income Transaction Cost Analysis
It is often said that the fixed income markets of today are like the equity markets of decades ago. It is also said with equal frequency that fixed income trading is nothing like equity trading. There are elements of fact and fiction to both statements.
While fixed income trading has begun the long journey to electronification and started to borrow equity trading techniques (portfolio trading, algorithms, executable quotes, for example), the reality is that fixed income instruments are illiquid in comparison to equities as they mature, are often held until maturity, and are still relatively opaque with respect to pre-trade pricing data. As a result, too often the focus is on how fixed income differs from equities when it comes to trade cost measurement, but there is one key element of equity trade cost analysis that is ripe for use within fixed income. I am talking about slippage analysis. And without proper slippage analysis you cannot perform proper trade cost analysis.
Principal vs. Riskless Principal
When comparing trade costs in the fixed income market it is important to know the type of trade executed, principal or riskless principal. With principal trades a dealer is buying into or selling from inventory. In this case trade cost measurement is straightforward. The client execution price is compared to other prices in the market and the difference is the total cost. However, one must be careful in choosing which prices to use in the comparison.
For a riskless principal trade, a broker executes a buy and a sell with the client portion of the order in-hand. Here trade cost measurement traditionally involves comparing the client price to the other leg of the riskless principal pair – but this is insufficient. This only tells you how much your broker made, not how much you, the client, lost. To understand total cost for a riskless principal trade it is necessary to also understand the role of slippage.
Total Cost
For a principal trade the total cost is the same as the classically calculated mark-up or mark-down on the trade. For a riskless principal trade, the total cost is equivalent to the mark-up or mark-down plus slippage. We will define slippage as the difference between where a broker did execute, and where they could have executed, the street-facing leg in a riskless principal pair. Viewed this way, slippage is an opportunity cost. For example, when a client buys a bond in a riskless principal transaction, slippage is the difference between where the broker acquired the bond in the street and where they could have acquired the bond. If a broker pays 100.00 for a bond that is then marked up to 101.00 for sale to the client, the client may view their cost as 1%. If at the same time dealers are trading the same bond amongst themselves at 99.50, then there has also been slippage of 0.50 in this trade. The real cost to the client is 1.507% ((1.00+0.50)/99.50 = 1.507%).
How Important is Slippage?
Very.
BondWave computes trade costs for every trade report disseminated by TRACE and EMMA. Since we began performing these calculations in 2016, we have calculated and stored over 580 million measurements on over 150 million trades. We call this our QMarks data set. It is invaluable for research and development as well as providing data to calculate total cost benchmarks for our Transaction Quality Service. Using this data, we can examine the role slippage has played in total trade costs for riskless principal trades.
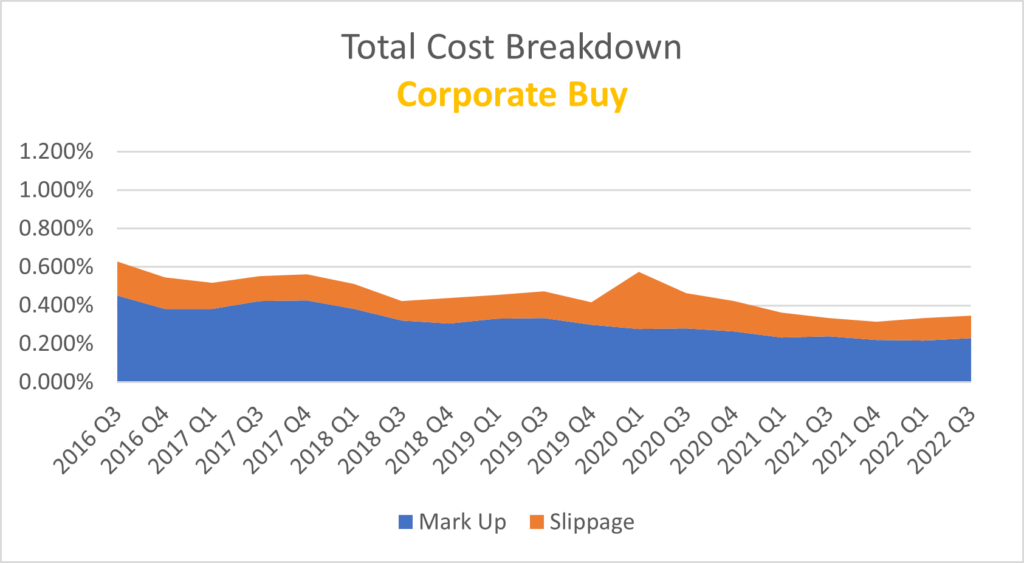
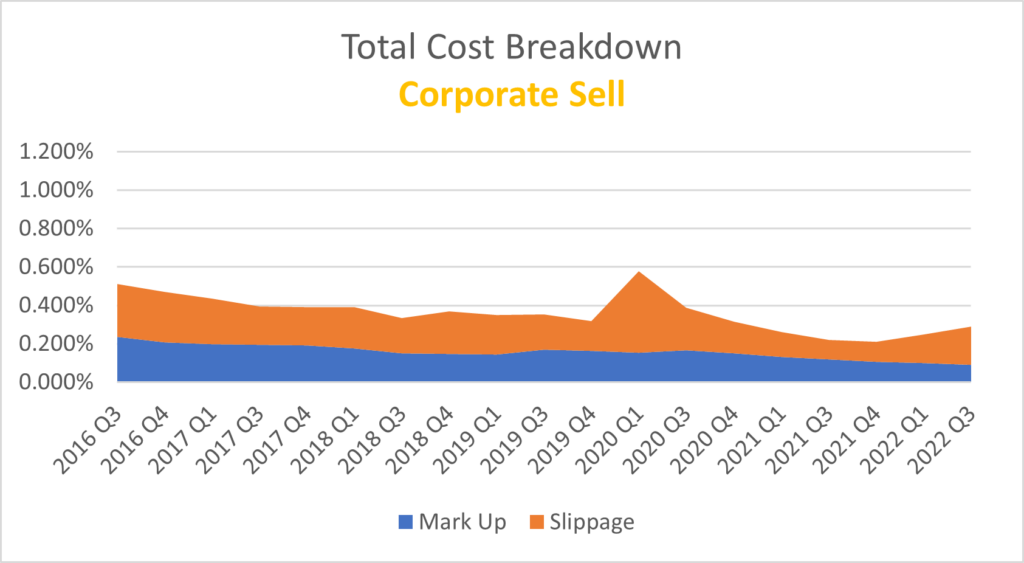
The breakdown of total cost between mark-ups and slippage for corporate bond buys (Graph 1) and sells (Graph 2) reveals the importance of measuring slippage as an important part of understanding the total cost of trading in fixed income markets. The first thing to note is that a sell experiences significantly greater relative slippage cost than a buy.
Graph 1
Graph 2
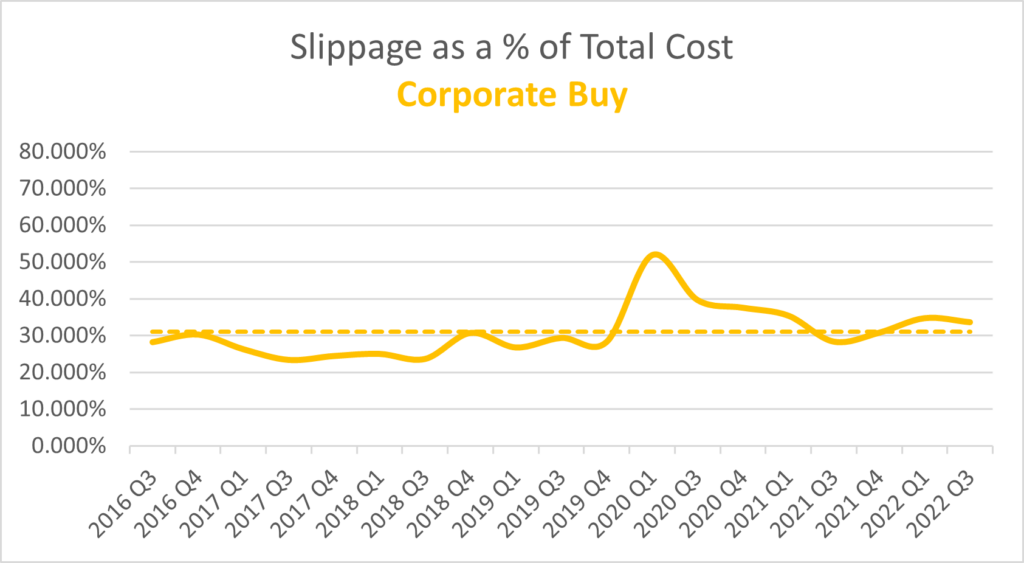
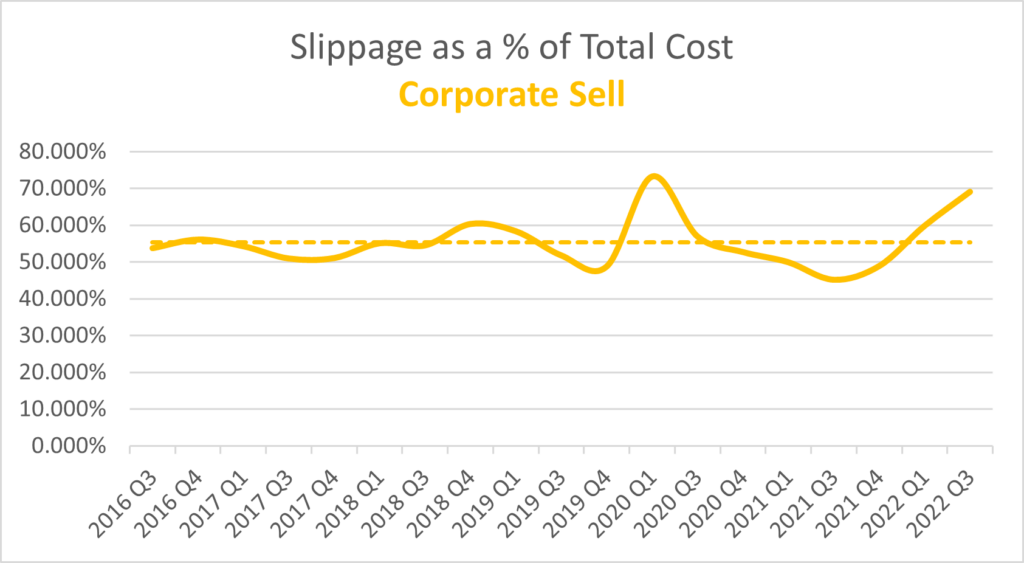
When viewed as a percentage of total cost, slippage on corporate buys have averaged 30% of the total cost (Graph 3). Meanwhile, corporate sells have averaged close to 55% of the total cost (Graph 4).
Graph 3
Graph 4
Managing Total Cost
That which is not measured cannot be managed. The only way to reduce slippage on fixed income trades is to first understand the dynamics of slippage, then begin to measure slippage, and finally to devise trading strategies to reduce slippage. Constant measurement can then be used to determine effectiveness of the trading strategies devised to reduce slippage. It is also critical to provide anonymized versions of this data to counterparties. In our conversations with clients, we hear that they use a variety of metrics to evaluate and score their brokers. In the early days, these metrics were somewhat crude as data was not readily available. So, a broker might be measured by fill rates or response times. The natural result is that brokers filled a greater percentage of orders and did so in a timelier fashion. It follows that if you want to improve total cost of transacting, that should become the metric broker allocations are based on. And this can only be done with proper slippage calculations.
The Data
BondWave provides Transaction Quality Analytics for corporate (registered and 144a), municipal, and agency bonds through its QMarks database of transaction costs. Beginning in 2016 for registered corporate and municipal bonds and beginning in 2018 for 144a corporate and agency bonds, BondWave has calculated and stored fair value calculations for every disseminated trade available via TRACE (corporate and agency) and EMMA (municipal). As of August 10, 2022, BondWave has performed these calculations for 154,296,514 trades resulting on 580,494,445 unique benchmark values.
