Introduction
Fixed income quotes have multiple use cases; they are used for regulatory purposes such as fair pricing and best execution, portfolio valuations, buy and sell decisions, trade negotiations and transaction cost analysis, making them a critical input to investment decisions. Unlike the equity market, these quotes are almost always indicative. Some fixed income markets show two-sided quotes. Some markets show one-sided quotes. And some markets show no quotes at all. Most notably, there is no single market mechanism to aggregate quotes from all available sources to create a national best bid and offer. At any one point in time, a bond trader has a limited view to “the market” as defined by all available quotes.
We questioned the degree of quality of these quotes as measured by the difference between the price of a bond as indicated by a quote and the price as indicated by a subsequent trade. Are fixed income quotes a true indication of the price at which a dealer is willing to execute a trade? Or should they be viewed as invitations to negotiate? If quotes are to be relied upon for all the purposes listed above, it is important to understand their nature and to answer these questions.
Data
In an earlier companion article, we examined the quality of corporate bond quotes. In this piece, we will extend the analysis to examine the quality of municipal bond quotes. The decision to separate corporate bond quote analysis from municipal bond quote analysis was driven by large differences in amounts and concentrations of data between the two markets. For example, while our data contains nearly ten times as many municipal CUSIPs as corporate CUSIPs (166,510 vs. 16,965), it contains less than one quarter as many municipal trades as corporate trades (416,712 vs. 1,737,333). And the municipal data that is present is highly concentrated in investment grade buy side trades (394,044 or 94.6%).
The reality of the municipal bond market is that there are very few standing bids on any ATS. Most sales of municipal bonds are completed through a bid wanted process, where a bid is shown to a customer upon request only. For this reason, our analysis will focus on the quality of municipal bond offerings only. However, for completeness we have included an appendix with municipal bond bid quality data. A similar relationship exists in the data when viewed by ratings. Investment grade bonds have significantly more trade and quote data in the municipal marketplace than high yield bonds. Table 1 outlines the data concentration.
Table 1
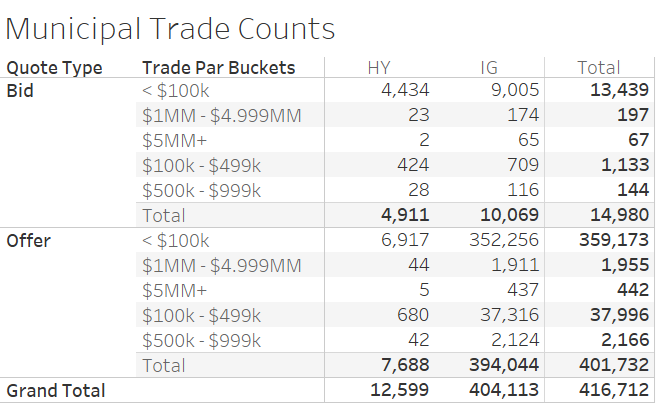
Source: MSRB, BondWave BDTI
In this paper we examine the relationship between municipal bond offers and trades in the inter-dealer marketplace by comparing offer prices and sizes from a single ATS to dealer-to-dealer trade prices and sizes as disseminated by FINRA for the period January 1, 2021, through August 31, 2021.
We only use dealer-to-dealer trades in this analysis to remove the pricing bias introduced by the inclusion of mark-ups and mark-downs in customer trades. Furthermore, because the ATS we pull prices from is a dealer-to-dealer market it is logical that we filter our trade set to only include dealer-to-dealer trades.
To be included for our analysis, a dealer-to-dealer trade must also be part of a riskless principal pair. This requirement allows us to designate the side-of-market for dealer-to-dealer trades by using the side-of-market for the associated customer leg in the pair. If there is a dealer-to-dealer trade at approximately the same time1 and for the same size as a sale-to-customer trade, then the dealer-to-dealer trade will be classified as a buy and compared to the existing offer.
We use only the best offer available from a single ATS. By ignoring offers behind the best offer we may miss effects that can be explained by size differences between the desired trade and the best offer. For example, if a desired trade is larger than the best offer, it is possible that a trader would move to the next best quote that completes their order rather than execute the order in multiple pieces. This may be done for a variety of reasons (to avoid information leakage, or to create operational efficiency, for example). Also, if a desired trade is smaller than the best offer it is possible that the offer has a minimum fill quantity that would prevent the desired trade from executing against it. Finally, due to the presence of counter-party filtering in the fixed income market, a desired trade may not even be aware of the existence of what we consider to be the best offer in this study as our quote data has no counter-party filter applied.2
Our match between dealer-to-dealer trades and offers is contingent on the presence of an offer on a single fixed income ATS. Because only a single ATS is used in the analysis and only dealer-to-dealer trades that are part of a riskless principal pair where the customer trade is a buy are used, only a subset of disseminated trades are analyzed using this method. During the relevant period there were 1,906,818 municipal bond dealer-to-dealer trades disseminated by MSRB. Of these 550,047 (28.8%) were assigned an offer side-of-market designation using the method described above. Among the subset of dealer-to-dealer trades assigned an offer side-of-market designation 401,732 (21.1% of total, 73.0% of designated subset) also had a live quote available at the time of trade.
Once the trade/quote pairs have been established we calculate the percentage deviation between the offer price and the trade price. This simple metric will provide our measure of quote quality. In our framework, the closer the ultimate trade price is to the offer (and the closer our metric is to 0), the higher the quality of the quote.
Quote Quality = (Offer Price / Trade Price) – 1
- a positive value means the trade was price improved relative to the offer.
- a negative value means the trade was executed through the offer.
Results
For the period January 1 to August 31, 2021, municipal bond offer prices averaged 15 basis points higher than executed buys in the dealer-to-dealer market. Said another way, trades received an average of 15 basis points of price improvement for buys.
Across our data set, for 95.5% of bids and 56.8% of offers, trades occurred at better prices than the quotes. For 1.8% of bids and 30.4% of offers, trades occurred at the same price as the quote. And for 2.8% of bids and 12.8% of offers, trades occurred at prices worse than the quote.
Quote Quality by Rating and Trade Size
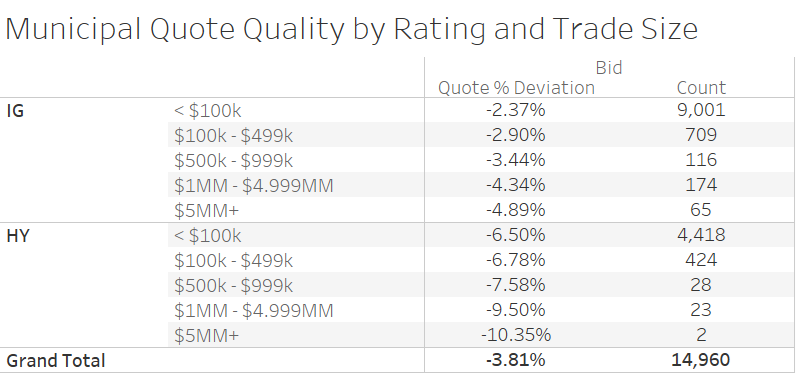
While our global average was 15 basis points of price improvement, the actual amount varies greatly depending on a few factors. Fixed income pricing has been shown to be both size and ratings sensitive. Larger trades tend to receive more favorable pricing than smaller trades. And investment grade bonds are less volatile than high yield bonds making posting bids or offers in investment grade bonds less risky. We bucketed the data by rating and trade size to determine relative effects. While all trade sizes and rating types receive price improvement on average, large sell trades ($5,000,000 and up) receive more price improvement than small trades. This is similar to the relationship we saw in the corporate bond data.
Municipal trading is dominated by small trades and the same holds true for our data set. With 87.7% of the observations (352,256 of 401,732) coming from investment grade municipal bond trades of less than $100,000 par, the global average is dominated by this figure. However, as trade size increases and ratings change the experience can be very different than the average.
Table 2
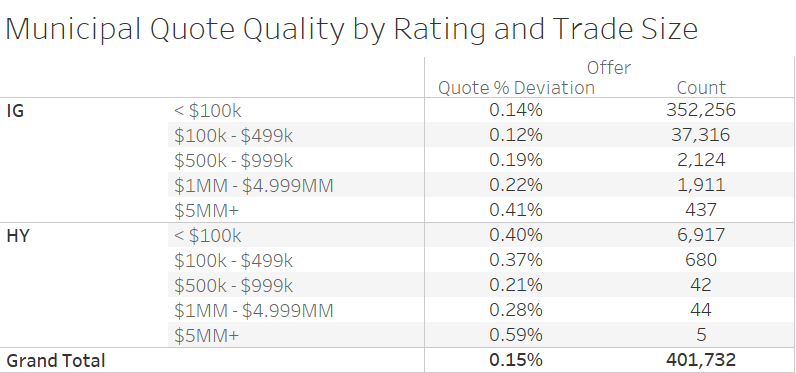
Source: MSRB, BondWave BDTI
Quote Quality by Rating and Quote Size
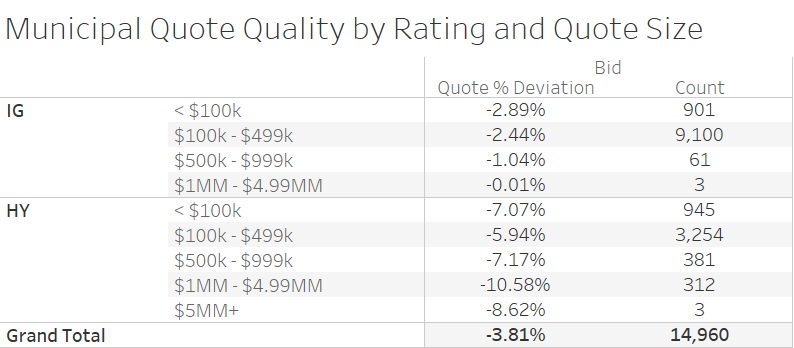
In practice, the quote precedes the trade. An underlying assumption is that the presence of the quote is what causes the trade to occur (questionable regarding municipal bids). Therefore, we also want to examine the effect of offer size on price improvement. We find that for investment grade municipal bonds very large offers ($5,000,000 par and greater) improve in efficiency relative to large retail and small institutional offer sizes (between $100,000 and $4,999,999 par), though they still lag very small offers. This is not to say that large offers are worse than small offers, only that they are not as efficient (i.e., there is more room for price improvement).
Table 3

Source: MSRB, BondWave BDTI
Quote Quality by Rating and Trade and Quote Size
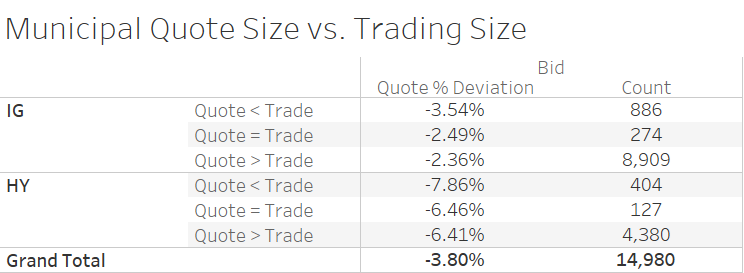
To examine the combined effects of quote size and trade size we organized the data into three groups: where the offer size is less than the trade size, where the offer size is equal to the trade size, and where the offer size is greater than the trade size. For offers, the majority of observations fall into the category where the offer size is equal to the trade size.3 When organized in this fashion we see the same pattern. Regardless of the relative quote size to trade size the opportunity for price improvement exists across the board, though in this case the least amount of price improvement occurs when the offer size equals the trade size. This is an interesting result as we believe that when an offer size is equal to the trade size there is a greater likelihood that the trade in question interacted with the offer in question.
Table 4
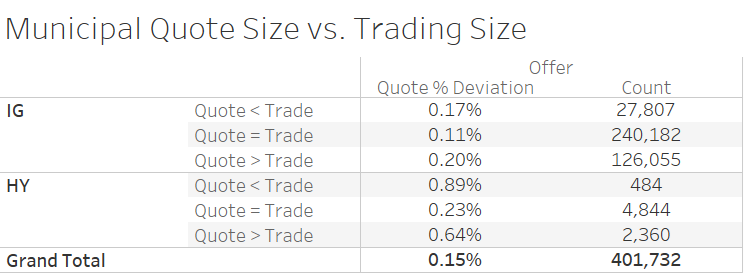
Source: MSRB, BondWave BDTI
Quote Quality Time Series
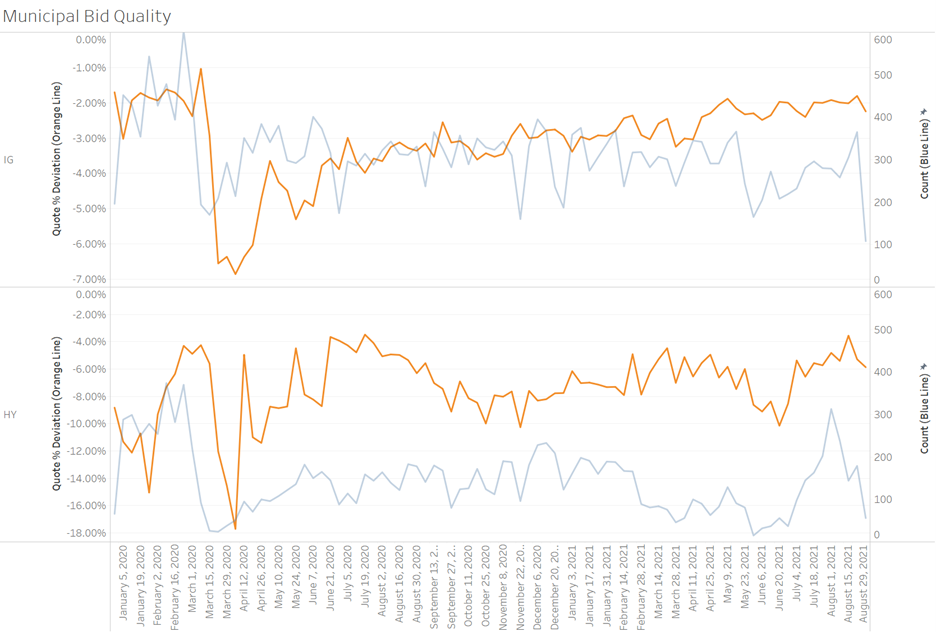
This effect also persists through time. Each individual day in the period exhibited the same pattern; on average trades occur at prices better than the best available offer. For the graphic below we also expanded the time frame to include all of 2020. We did not include 2020 in our prior analysis due to the excessive skew that pandemic quoting would introduce to all averages. While it is interesting to include 2020 in a time series, it is not valuable for making statements about market dynamics in normal environments.
It is also interesting to note that high yield bond offerings in our study did not react to the start of the pandemic the way that investment grade bond offerings reacted. It can also be seen that our quote quality statistic is more volatile for high yield municipal bonds than for investment grade.
Graph 1
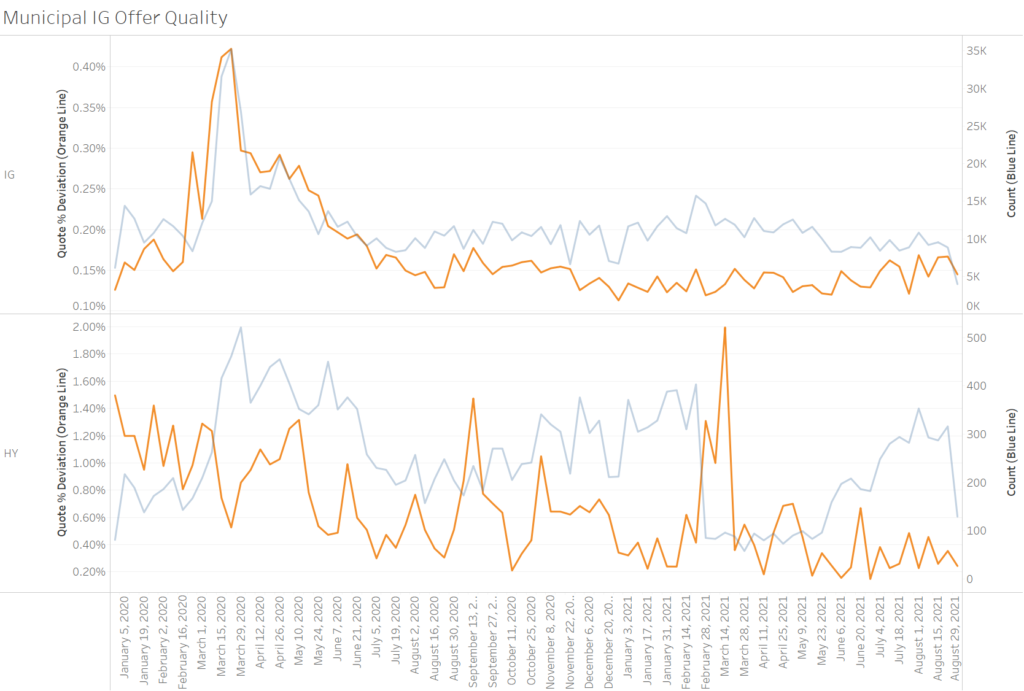
Source: MSRB, BondWave BDTI
Conclusion
While our quote quality study is limited based on a lack of publicly available consolidated quotes, we can draw the following conclusions based on our single ATS source of data:
- The majority of municipal bond dealer-to-dealer offer side trades occur at prices better than the offer.
Across all ratings categories 56.8% of buys occurred at prices better than the offer. Within investment grade bonds 56.7% of buys occurred at prices better than the offer. Within high yield bonds 60.5% of buys occurred at prices better than the offer. - Bids for municipal bonds are rare on an ATS.
As will be seen in the appendix they are also of extremely low quality. - High yield municipal bonds have lower quote quality than investment grade bonds.
With higher risk comes greater caution when posting bids and offers. The same phenomena with exaggerated effect can be seen in the time series data. During the height of the pandemic dealers widened their quotes beyond where they were willing to execute trades by hundreds of basis points. - Municipal bond purchases frequently occur at the exact size in which they are offered.
These trades also experience the least amount of price improvement (have the highest quote quality).
Appendix
For completeness we include data for municipal bond bids on our single ATS. Care should be taken in interpreting this data as there is very little of it.
Table 5
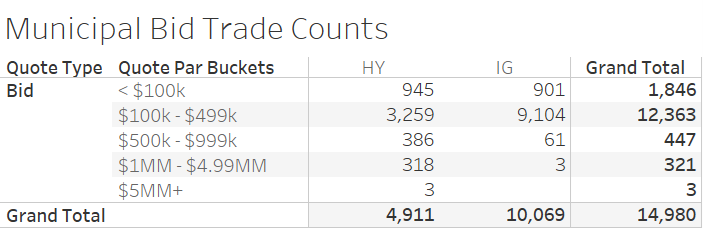
Source: MSRB, BondWave BDTI
Table 6
Source: MSRB, BondWave BDTI
Table 7
Source: MSRB, BondWave BDTI
Table 8
Source: MSRB, BondWave BDTI
Graph 2
Source: MSRB, BondWave BDTI
1 For municipal bond trades we use a +/- 300 second window from the time of the dealer-to-dealer trade. In our prior analysis of corporate bond quotes we used a +/- 60 second window. The respective windows reflect the reporting conventions in the respective markets.
2 Not all market participants can or want to trade with each other. Market participants can filter each other out, or get filtered out, of each other’s quote stream.
3 For investment grade offers, 61% of offer sizes were equal to the trade size. For high yield offers, 63% of offer sizes were greater than the trade size. This is in contrast to the corporate bond market where we found the majority of our offers are greater than the trade size. See: Examining Corporate Bond Quote Quality, BondWave 2021.
