Examining BondWave’s enhanced trade data through a single Pacific Gas & Electric bond in the news
Key Takeaways:
Providing a unique view into the traditional world of fixed income, Benchmark Data and Trading Indices (BDTI) leverages advanced data science and extensive fixed income expertise to provide fully transparent, independent and unbiased trading insights. BondWave has developed an algorithm to help identify the side-of-market on dealer-to-dealer trades. One of the offshoots of this algorithm is that it allows greater granularity in the classification of trades. BDTI reveals interesting insights about PG&E, including:
- Riskless principal trading dropped to 20% of volume in Q4 2018 and never exceeded 11% of volume in 2019, reflecting a lack of retail trading
- Pre-trade and realized bid/ask spreads showcases similarities in how volatile they become in response to news
- A consistent relationship is identified between mark-ups and mark-downs
- Although there are few instances of negative bid/ask spreads or inverted markets, the largest negative customer-to-customer bid/ask spread is a likely trade reporting error
- One of the benefits of organizing the reported trade data by side-of-market at both the dealer-to-dealer and dealer-to-customer level is we are able to detect illogical patterns that may be the result of manual and error-prone trade reporting practices.
It is estimated that in 2002 there were 23 exabytes of information recorded and replicated. By 2011 that amount of information was believed to be recorded and transferred every seven days (Moore, 2011). Statistics like this are usually meant to catch the eye and impress with the implication that this exponential data growth has led to a commensurate growth in knowledge.
At BondWave, we tend to come from the Nate Silver school of thought that the flood of data we are now able to generate adds to the pile of noise much faster than it adds to the pile of signal (Silver, 2012). We also believe that the fixed income market has been relatively data light. As BondWave’s Information Lab has dug into the publicly available data sets on fixed income transactions, there are certain transformations and reformulations of the data that seem to make sense to us. The derived data we generate seeks to add to the signal without any contribution to the noise.
BondWave’s recently launched Benchmark Data and Trading Indices (BDTI) provide an incremental aggregation of information derived directly from reported trades. To illustrate some of the data available using BDTI, we will examine the events surrounding Pacific Gas and Electric (PG&E) and the impact it has had on the trading of their debt. All the illustrations below will use the PG&E 3.5% maturing on 10/1/2020 (CUSIP 694308GT8).
PG&E has been in the news consistently for the past year. After a series of wildfires were found to have been sparked by PG&E equipment, the company incurred liabilities that have forced it to seek bankruptcy protection. While public officials, regulators, courts, company executives and bondholders negotiate to seek a solution, the market has reacted to each update, positive and negative, in interesting ways. With BDTI data, we seek to quantify some of those reactions.
Characteristics of Trading
PG&E filed an 8-K with the SEC in June 2018, suggesting for the first time the utility may need to seek bankruptcy protection as a result of the company’s liability for numerous forest fires. Beginning with the third quarter of 2018, the volume of trading in PG&E debt begins to climb reaching its peak in the first quarter of 2019 when in early January, first S&P and then Moody’s downgraded the company’s debt to junk status. By the end of January, the company officially filed for bankruptcy.
BondWave has developed an algorithm to help identify the side-of-market on dealer-to-dealer trades. One of the offshoots of this algorithm is that it allows us to categorize trades into three broad categories. We identify which customer trades are executed on a riskless principal basis and which are bought or sold directly from dealer inventory (Figure 1). This also allows us to isolate dealer-to-dealer trading separate from customer activity. As events overtake PG&E, we see a shift in the balance of trading among these three categories.
Riskless principal trading, which represented ~31% and ~35% of volume in the second and third quarters of 2018, dropped to ~20% of volume in Q4 2018 (Figure 2). In 2019, riskless principal volume never exceeded 11% of volume. This slack is picked up by dealers trading with customers out of their inventory (Q4 2018) or a combination of inventory trading and trading between dealers (all of 2019).
Figure 1
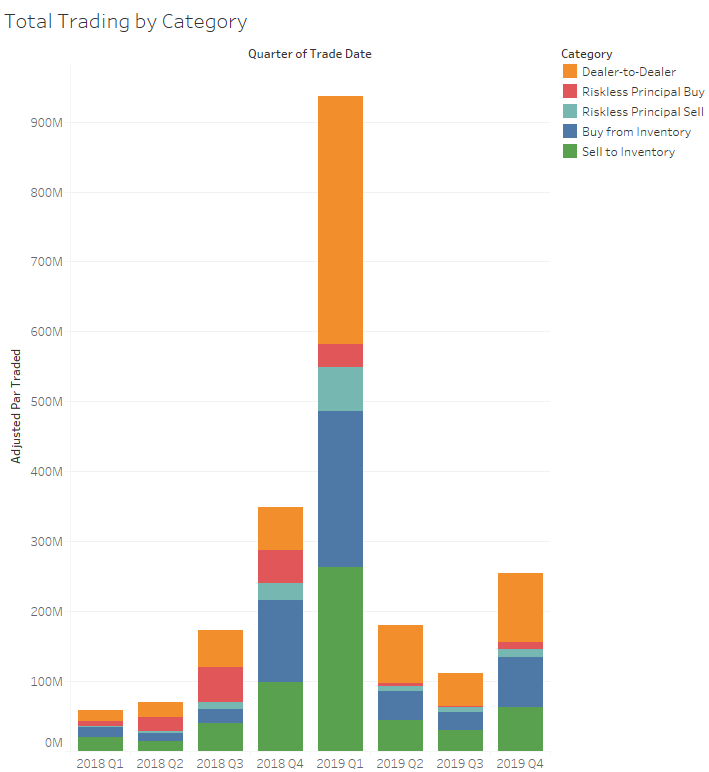
Source: BondWave BDTI
Note: Par values prior to January 2019 have been adjusted to reflect the lower size dissemination cap instituted by FINRA after PG&E’s downgrade to high yield status.
Figure 2
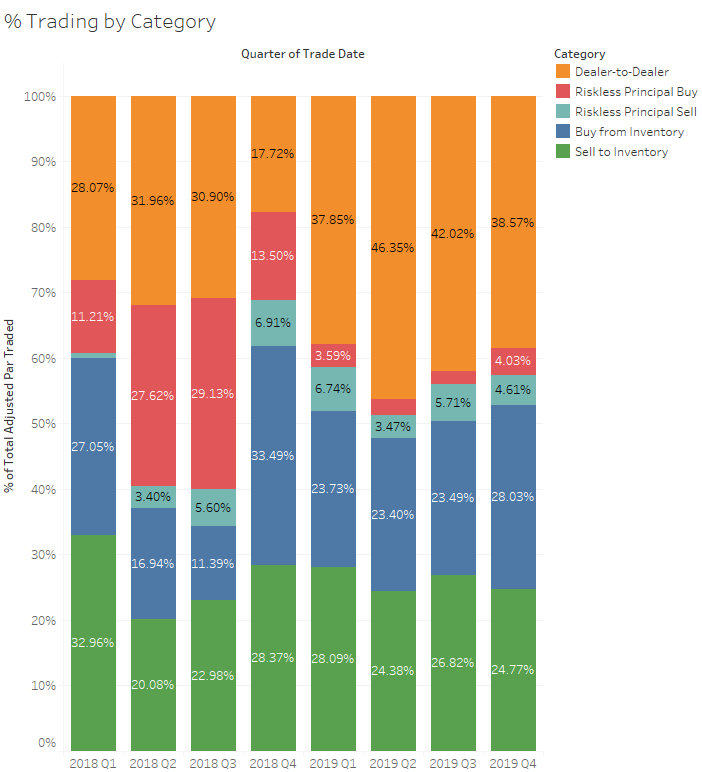
Source: BondWave BDTI
Note: Par values prior to January 2019 have been adjusted to reflect the lower size dissemination cap instituted by FINRA after PG&E’s downgrade to high yield status.
Riskless principal trading seems to be focused in retail sized trades. A decrease in riskless principal trading is likely to reflect a lack of retail trading.
Bid/Ask Spread
BDTI provides the ability to extract realized bid/ask spread information from publicly reported trades. For most bonds with minimal pre-trade quote transparency this is important incremental information. PG&E is unique in that pre-trade information is also readily available on both sides of the market. We can use this to understand the relationship between pre-trade indications and post-trade outcomes.
Using the pre-trade quotes available on a major ATS (Figure 3), we see they react strongly to news – no news there.
Figure 3
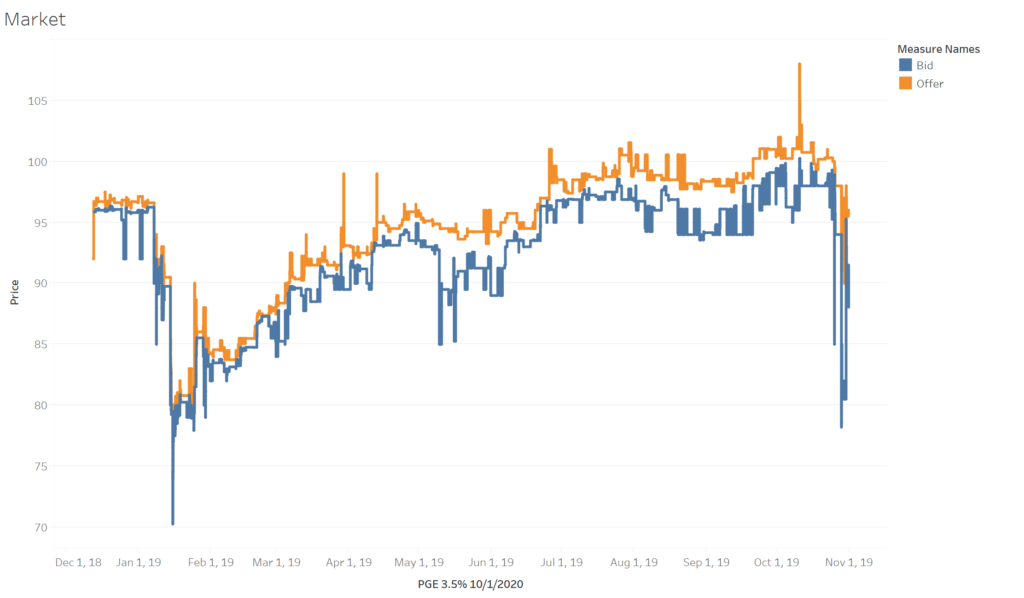
Source: ICE BondPoint
Figure 4
Source: ICE BondPoint
The realized bid/ask spread is significantly different from the pre-trade bid/ask spread in a number of ways (Figure 4). The extreme peaks seen in the pre-trade quotes are not reflected in any meaningful way in the realized spreads. The quotes are really just an invitation to negotiate. This is not unique to this security or this time period. We observe this behavior throughout the data.
The realized spread also has a tendency to turn negative in stressful times. A potential source of negative realized spreads comes from the fact that the trades on the opposite side of the market are not necessarily contemporaneous. If there is market moving bad news and a bid-side trade occurs before the news while an offer-side trade happens after the news, it can create the appearance of a negative bid/ask spread. We examined the negative spreads below and found that this was not the case. That leaves two other possibilities.
In a fast market, trade reporting delays (even if still within the 15-minute statutory limit) can also create the appearance of a negative spread. Alternatively, the dispersed nature of price discovery in the fixed income market can create an actual negative realized bid/ask spread.
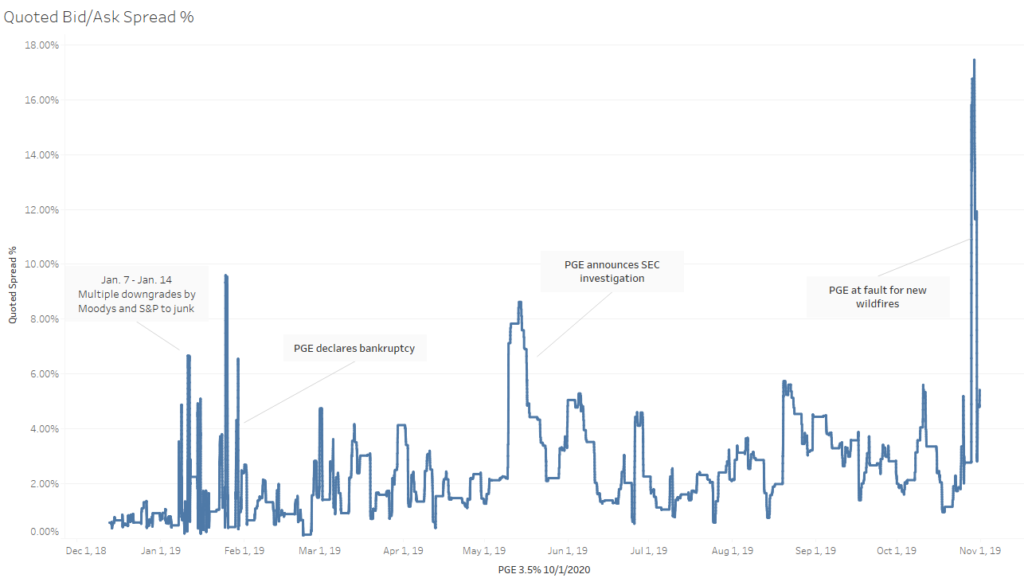
The pre-trade and realized bid/ask spread series are similar in how volatile they become in response to news (Figure 5). In January, as PG&E was being downgraded repeatedly before finally declaring bankruptcy, both series became very volatile. Again, at the end of September with a new breakout of wildfires that the company may be liable for, the series became volatile.
Figure 5
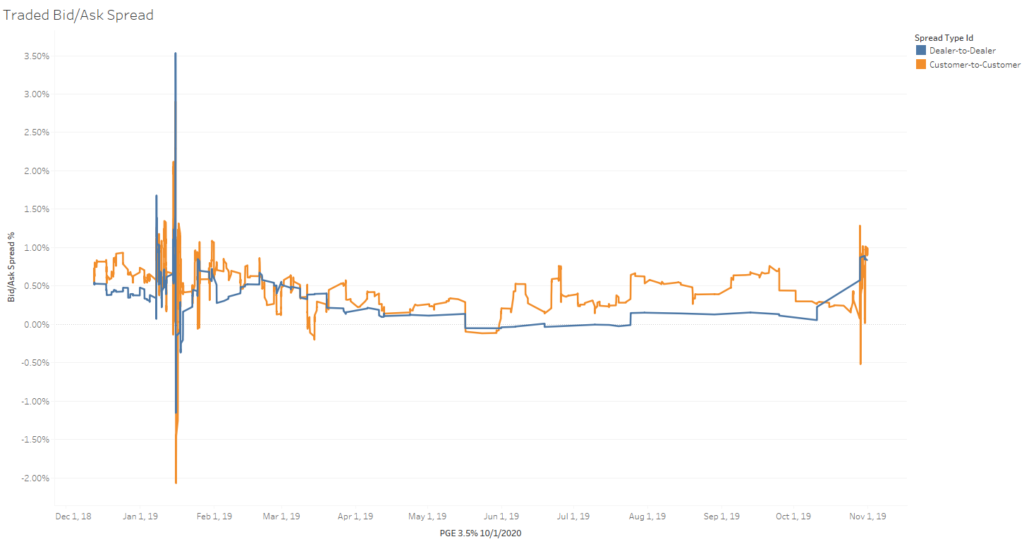
Source: BondWave BDTI
Mark-Ups and Mark-Downs
BondWave has found a fairly consistent relationship, across most factors, between mark-ups and mark-downs. Mark-ups are approximately double mark-downs. That approximate relationship has persisted in our data across time, effective maturity, security type, rating, yield, coupon, etc. Against that backdrop, it is unusual to see below that beginning in late 2018, that relationship first collapsed before it ultimately reversed, leaving mark-downs higher than mark-ups (Figure 6). This makes sense, of course. As the bonds increase in risk, buyers become rare. A broker is unlikely to allow their mark-up to stand in the way of executing a trade that will reduce their risk.
Figure 6
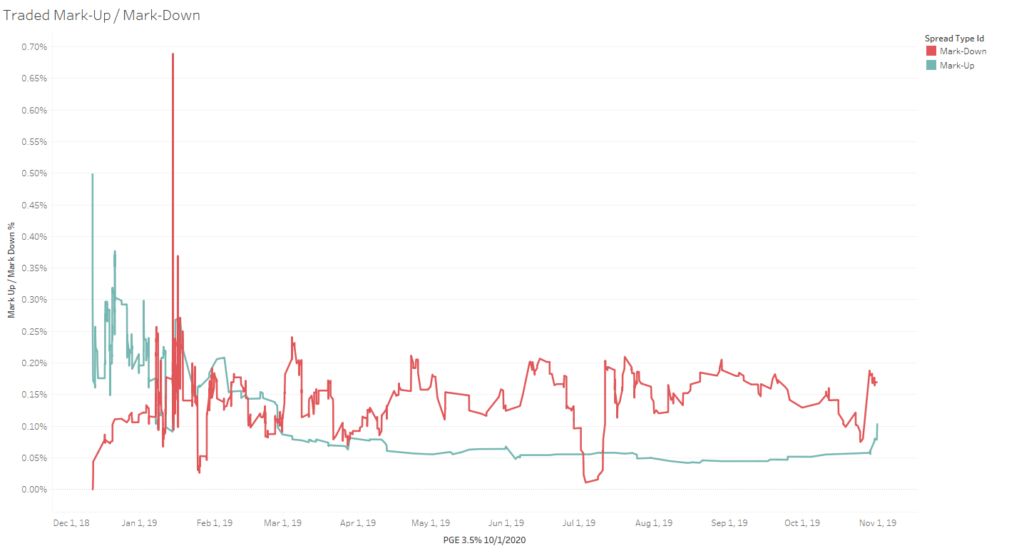
Source: BondWave BDTI
Error Detection / Data Integrity
In the Traded Bid/Ask Spread graph (Figure 5), there are a few instances of negative bid/ask spreads or inverted markets. There are multiple explanations for how this can happen. Certainly, in a fast moving, event-driven market with little pre-trade transparency and a relatively wide trade reporting window, there is always a risk of inverted, or seemingly inverted, markets as information is compartmentalized or delayed. Another possible explanation is that there is simply an error in how the trade was reported to the tape. The fixed income trade reporting processes appear to remain stubbornly manual in many cases, making them susceptible to typical human errors.
One of the benefits of organizing the reported trade data by side-of-market at both the dealer-to-dealer and dealer-to-customer level is we are able to detect illogical patterns that may be the result of manual and error-prone trade reporting practices. We currently maintain six categories of likely errors in trade reports:
| Category | Result |
|---|---|
| Price Input Errors | e.g. 110 instead of 101 |
| Yield Input Errors | Small errors lead to large price errors |
| Side-of-Market Errors | Seemingly inverted markets |
| Trade Corrections Processed Incorrectly | Compounding errors |
| Trade Throughs | Quote evidence contradicts trade |
| Illogical Price Patterns | High probability of mistake or other problem |
The largest negative customer-to-customer bid/ask spread (defined as a bid/ask spread where both sides involve a dealer-to-customer trade) in Figure 5 occurs on January 8, 2019. Lacing together quote data with dealer ask-side trade data reveals an orderly and organized market (Figure 7).
Figure 7
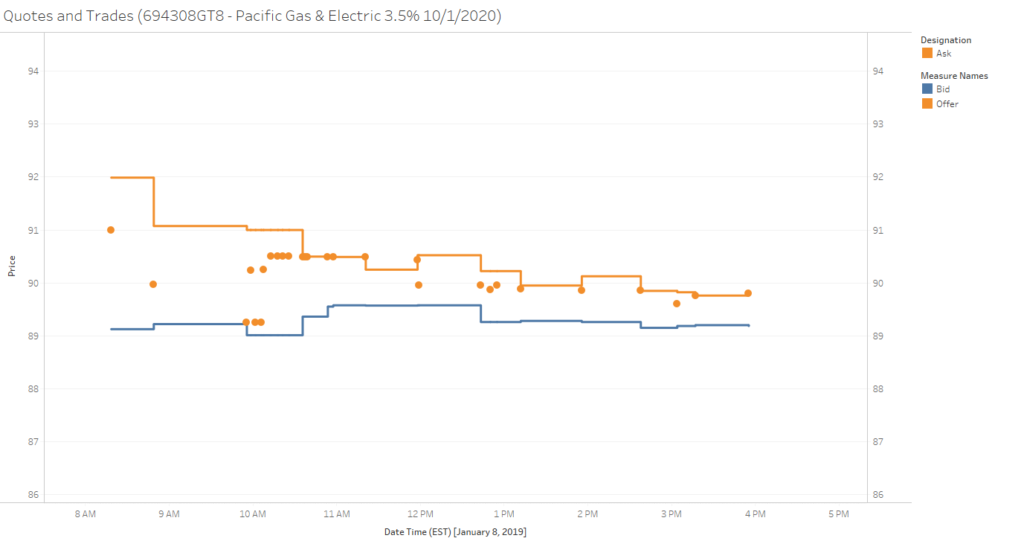
Source: BondWave BDTI, ICE BondPoint
It is only when we add dealer-to-customer trades to the mix that we see the obvious problem. As highlighted in Figure 8, there is a customer purchase of $500,000 par at 86.000. This occurs while the inter-dealer best bid on a major ATS is 89.550 for the same size and the best offer is 90.450.
Figure 8
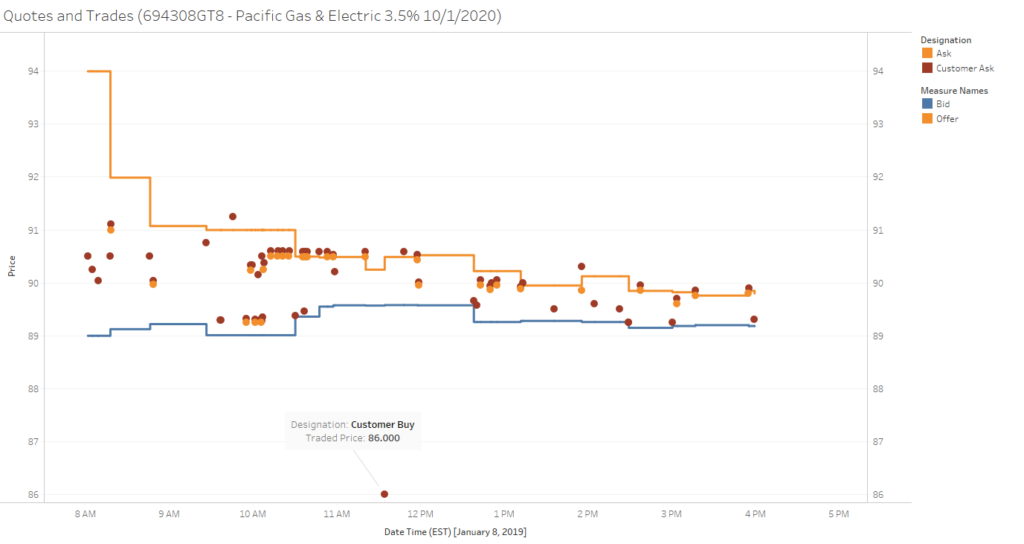
Source: BondWave BDTI, ICE BondPoint
There is a chance that this trade is accurate. In the middle of a busy trading day, during a heavy news cycle for the company, with a bond actively quoted on both sides of the market for relatively large size, a customer found a broker willing to sell them the bond 4% below the best bid on an ATS. It just seems unlikely.
Meanwhile on January 7, the day that S&P downgraded PG&E from BBB- to BB-, there is a negative realized bid/ask spread in the dealer-to-dealer market that appears to be accurate and the result of a fast moving series of events (Figure 9). The bid-side trade occurs at 8:01 a.m. EST while the offer-side trade occurs 74 minutes later. With a heavy news cycle and a large time difference between the bid-side trade and the offer-side trade, it is likely that we have captured market movement rather than an inverted market. Controlling for the time difference between bid-side trades and offer-side trades in fast markets solves this data issue.
Figure 9

Source: BondWave BDTI
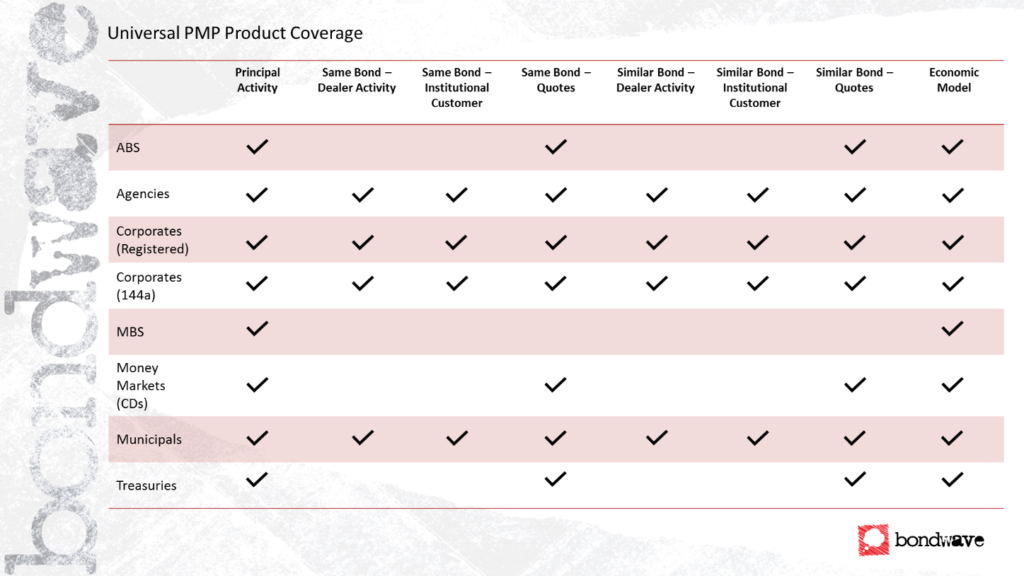
Universal PMP
The BDTI data set comes together with the concept of a Universal Prevailing Market Price (UPMP). Building on top of the processes required by industry regulators to measure mark-ups and mark-downs on retail trades, we can enrich the process and data to provide a way to measure executions on any size trade for a variety of use cases. BondWave has argued that the Universal PMP approach has the ability to become for bonds what the volume weighted average price (VWAP) has become for equities, a well understood and valuable metric for measuring executions.
Brokers performing fair pricing and best execution reviews are able to access a robust, multilevel set of execution metrics that place their trades in the proper context. Universal PMP provides a rigorous, intelligent framework for analyzing pricing by providing every level and every step of the PMP waterfall to better understand the circumstances of each trade as well as the ability to aggregate across any related trades.
Buy-side traders can use Universal PMP the same way they currently use equity transaction cost analysis. By measuring trading outcomes and analyzing patterns, they can create a positive feedback loop that will benefit future execution quality.
Another benefit of calculating up to eight benchmarks for every trade that is reported to the tape is the possibility it presents to perform rich peer analysis. While comparing executions to a pre-determined metric for success is a valuable exercise to perform, it is also helpful to know where in the range of possible outcomes a result falls.
A trader should always have a strong sense of what a fair price for a trade is prior to executing the trade. That sense is often built from a long history of executing trades and understanding what is possible given the security and market conditions. Put another way, a trader has a sense of the cost of trades by measuring them against all their own past trades. With a Universal PMP data set, traders can now compare their execution not just to their own past experience but also to their peers’ contemporaneous experience. By isolating trades that are similar in key ways and placing their outcome into a distribution of peer outcomes, a positive feedback loop is established that can be used to affect future outcomes.
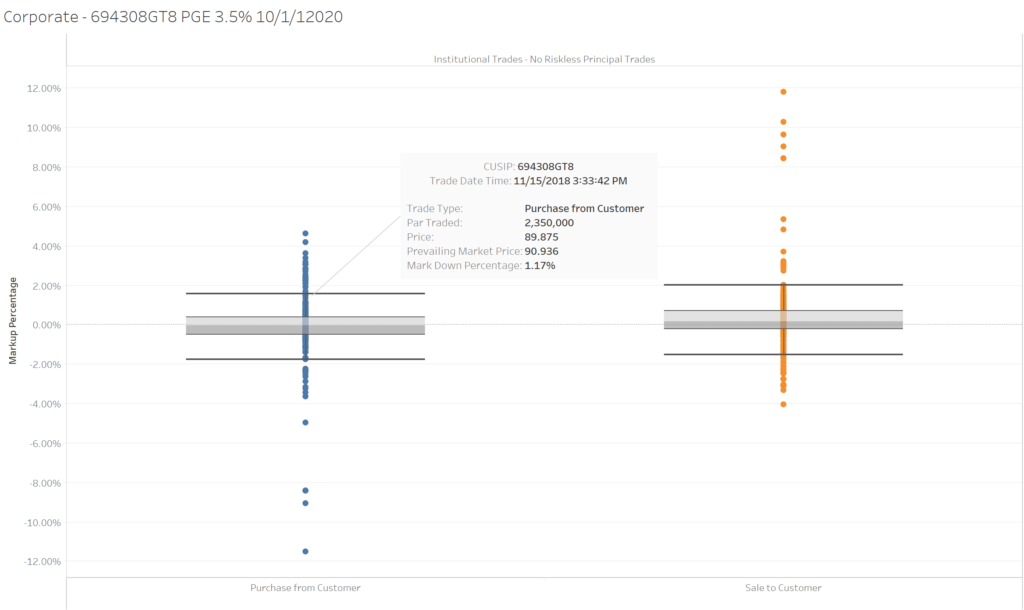
For example, in Figure 10 we highlight a trade that has a mark-down of 1.17%. In absolute terms, this is not a large mark-down but when we compare it to other similar trades (defined here as the same CUSIP and at least 1,000,000 par traded, that were not executed on a riskless principal basis) in a distribution, we see that it is in the top 25% of costs (the grey boxes represent the middle quartiles of the distributions).
Figure 10
Source: BondWave BDTI
Conclusion
Analyzing and quantifying trade quality has always required placing a trade in its proper context as a first step. Without the proper context for a trade, any conclusions that are drawn from an analysis are invalid. The challenge for fixed income market participants has always been identifying the proper benchmark to which trades can be compared.
Enhanced data sets like BDTI help to promote a greater understanding of the fixed income market by expanding on existing trade data. Adding side-of-market context to reported trades; quantifying the difference between pre- and post-trade bid/ask spreads; realized spreads; using that enhanced data to build a complete benchmark data set and performing a detailed, accurate peer analysis is a necessary step in the right direction.
Bibliography
Moore, R. J. (2011, February 7). Eric Schmidt’s “5 Exabytes” Quote is a Load of Crap. Retrieved from RJ Metrics: https://blog.rjmetrics.com/2011/02/07/eric-schmidts-5-exabytes-quote-is-a-load-of-crap/
Silver, N. (2012). The Signal and the Noise: Why So Many Predictions Fail – But Some Don’t. In N. Silver, The Signal and the Noise: Why So Many Predictions Fail – But Some Don’t (p. 10). New York: The Penguin Press.
