Developed to help bond market participants better understand trading trends in the fixed income markets, BondWave’s Data Lab has released its QMarksTM dashboards for the fourth quarter of 2025.
QMarks is a proprietary BondWave data set that powers its quarterly dashboards to cover all disseminated bond transactions using the regulatory-prescribed Prevailing Market Price methodology for corporate, municipal, agency, and 144A. QMarks belongs to a suite of other BondWave proprietary data sets, including QCurves, QTrades, and QScores.
Beginning with this quarter, we will rotate in new data explorations to illustrate important industry trends. For Q4 2025, we have replaced the Corporate and Municipal PMP Level Distribution graph with an exploration of principal trading costs over time in those markets.
Q4 2025 Observations:
Corporate Bond Market Trends
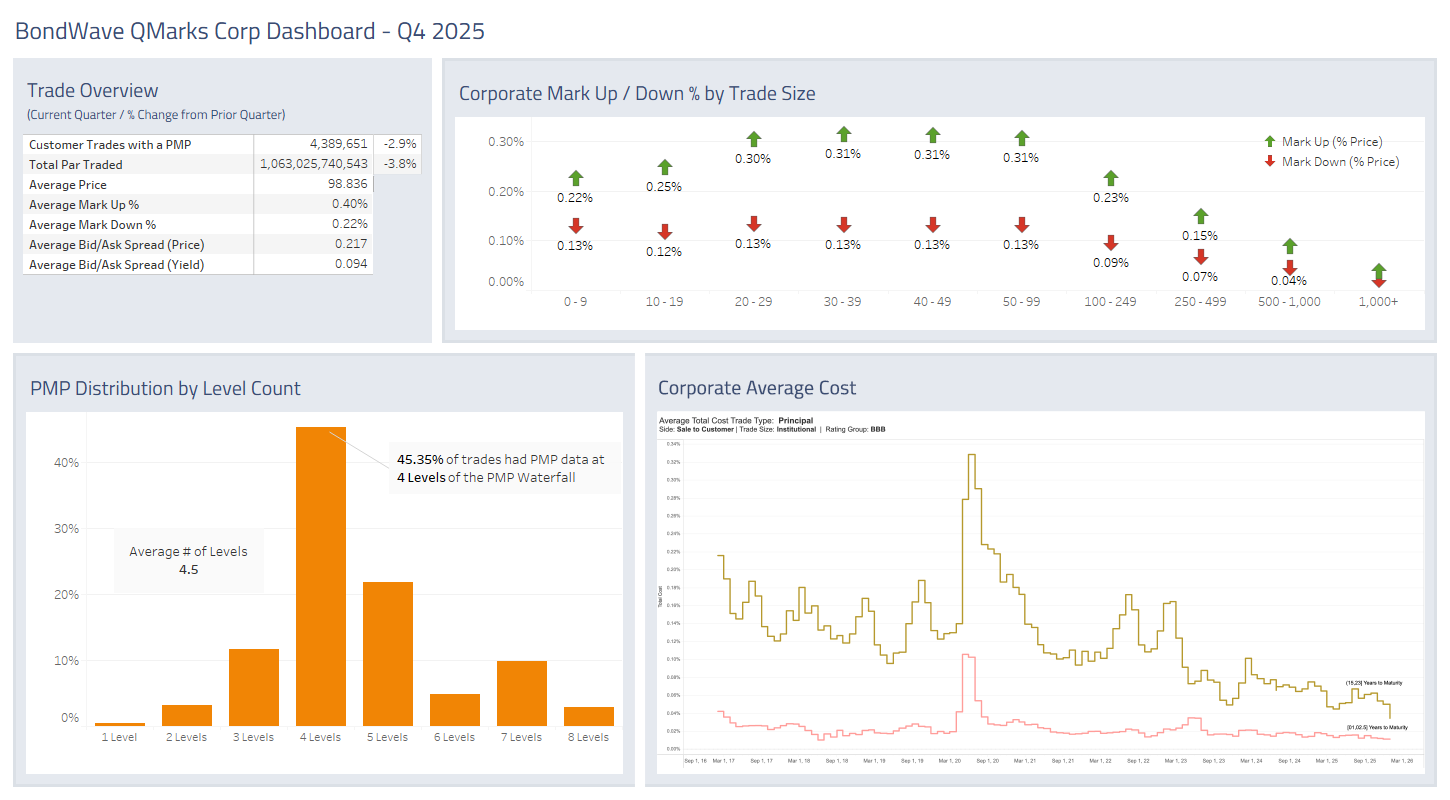
Source: BondWave QMarks
- Trade counts (-2.9%) and trade volume (-3.8%) shrank modestly relative to Q3. They also shrank modestly year over year (-0.7% and -0.6%).
- This contrasts with corporate new issuance, which shrank 21.5% quarter over quarter but grew 40.4% year over year (per SIFMA).
- Principal trading costs have been compressing for years. At the short end of maturities little has changed over time, as overall trade costs have hovered in the low single-digit basis points. Meanwhile, longer maturities have seen costs cut from 15-20 basis points down to well below 10 basis points.
- The primary driver of decreasing costs is increased automation of the pricing function, facilitated by the shift from banks as inventory providers to electronic trading firms as market makers.
144A Bond Market Trends
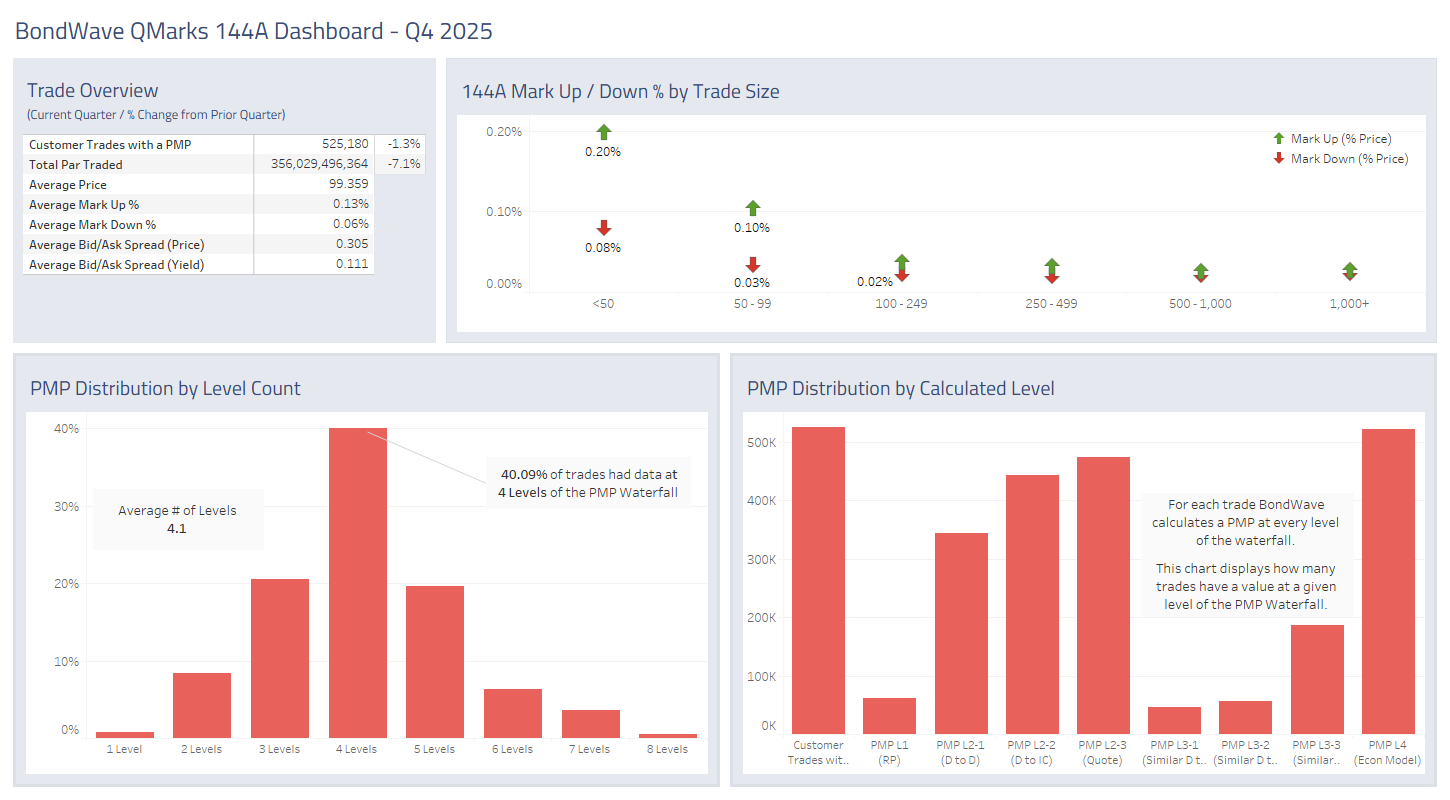
Source: BondWave QMarks
- Trade counts (-1.3%) and trade volume (-7.1%) shrank modestly relative to Q3.
- However, both trade counts (+18.9%) and trade volume (+15.5%) rose significantly year over year.
- The shifting volume had little impact on mark-ups and mark-downs.
Municipal Bond Market Trends
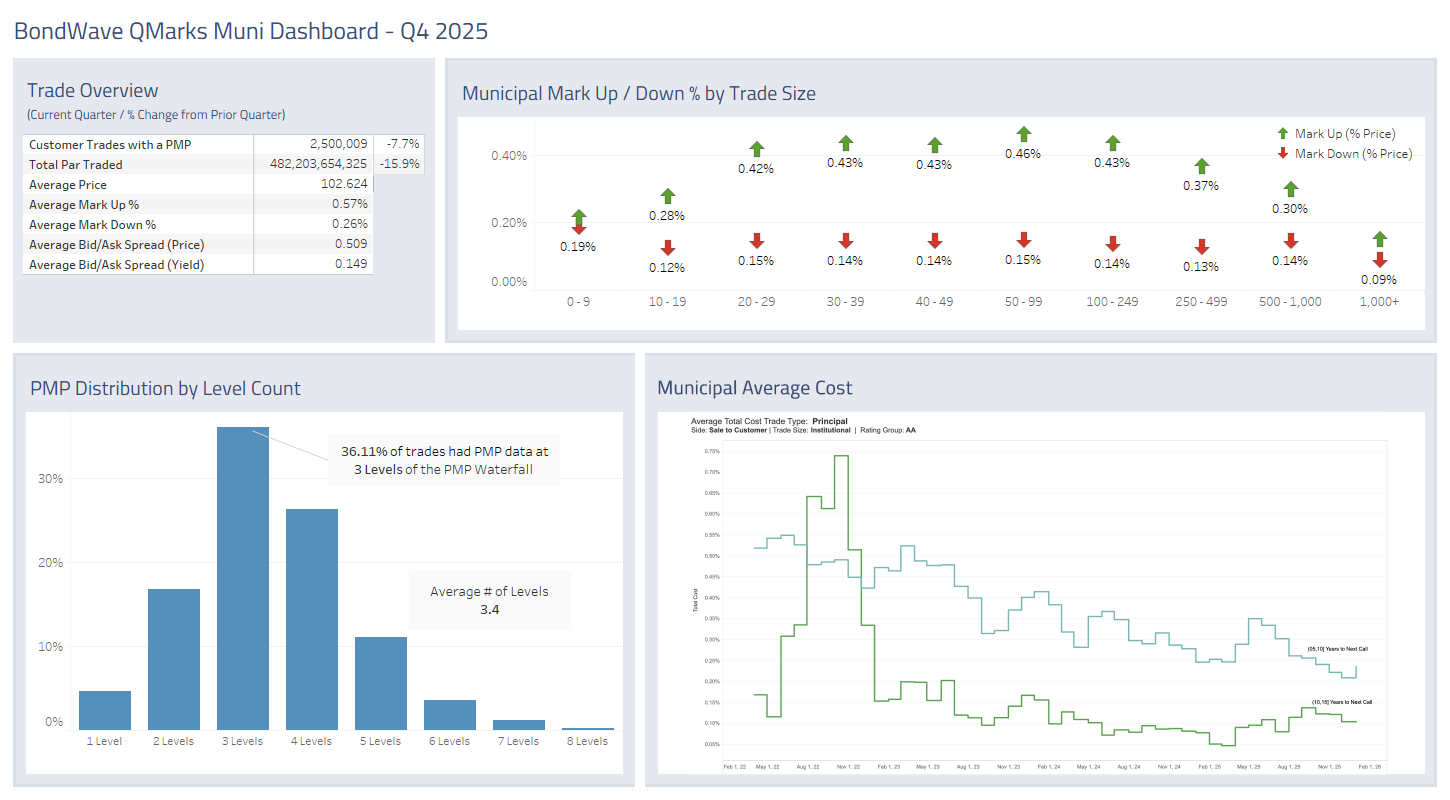
Source: BondWave QMarks
- Trade counts (-7.7%) and trade volume (-15.9%) shrank significantly relative to Q3. However, they grew year over year (+4.4% and +0.3%).
- New issuance was down 8.9% quarter over quarter, but up 12.5% year over year (per SIFMA).
- Principal trading costs have also followed a long-term trend of compression. Bonds with next calls between 5 and 10 years have benefited the most with a 50% decrease in average costs.
- The municipal market has benefited from increased ETF usage, increased pricing competition from electronic market makers, and increased new issuance.
Agency Bond Market Trends
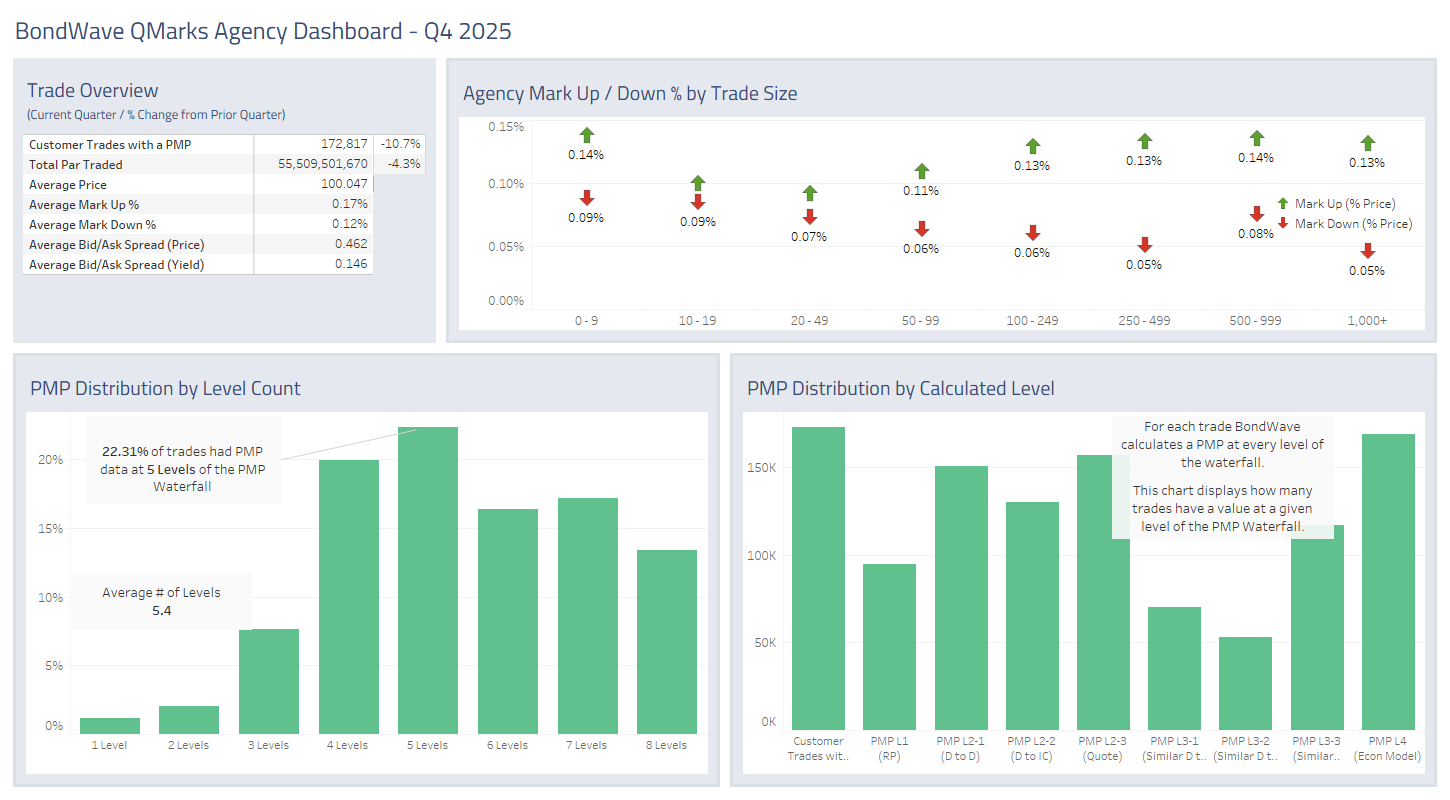
Source: BondWave QMarks
- Trade counts (-10.7%) and trade volume (-4.3%) shrank significantly relative to Q3.
- This represents a longer-term trend, as year-over-year trade count (-31.2%) and volume (-6.6%) numbers were weak.
- The decreased volume had little impact on mark-ups and mark-downs.
The dashboards for the previous quarter referenced above are located here:
Last quarter: Q3 2025 Dashboards
Year-over-year: Q4 2024 Dashboards
About BondWave LLC
Established in 2001, BondWave® is a financial technology firm specializing in fixed income solutions designed to enable clients to manage and expand their fixed income business with greater efficiency. We serve a wide range of clients, including traders, compliance professionals, RIAs, and asset managers, who use our tools to provide a superior fixed income experience to their clients while supporting critical regulatory mandates and optimizing workflows.
Effi®, our Engine for Fixed Income, is the single platform through which we deliver all our solutions – providing intuitive dashboards and insights into every fixed income position and transaction to drive informed investment and business decisions. Effi’s capabilities include Portfolio Oversight, Trade Oversight, and curated Muni News. Our solutions are fueled by proprietary data sets that are developed using AI, machine learning technologies, and advanced data science.
