Trade Insights – Volume 23
Introduction
One of the most discussed topics at fixed income industry conferences is corporate bond portfolio trading. There is always a panel dedicated to the topic and many that are not but still discuss it. Perhaps the only topic with more discussion currently is artificial intelligence. Despite all the talk, details about portfolio trading pricing are relatively sparse at these events. Other than broad statements of better execution, little is revealed. In this article we will use transaction quality analysis to make statements about the relative quality of portfolio trade executions and how the dynamic has changed over time.
Portfolio Trading
With the electronification of fixed income markets comes the addition of new trading protocols. One of the most significant new protocols for corporate bonds is portfolio trading, wherein whole lists of bonds are traded as a single package with a single negotiated spread price applied across all line items in the list. Demand for portfolio trading has grown uninterrupted – at least since FINRA began including a portfolio trading tag on disseminated corporate bond trades in April 2023. Corporate bond portfolio trading now accounts for nearly 8% of customer transactions and nearly 17% of customer par value traded.
Portfolio Trade Execution Quality
Using BondWave’s Transaction Quality Analysis (TQA) methodology, we are able to:
- Measure the total transaction cost for each portfolio trade.
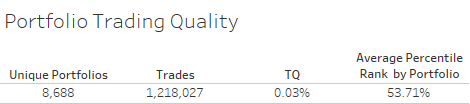
- Compare that cost to the distribution of peer group execution costs to determine the relative cost, or transaction quality, of the portfolio as a whole. We start by using a proprietary algorithm to group individually reported portfolio trades into logical portfolios (see addendum).
Each trade in a portfolio trade is ranked based on its percentile quality. A trade with the same transaction cost as its peer group will rank in the 50th percentile. A trade with an above average transaction quality (below average cost) relative to its peer group will have a rank above the 50th percentile. And a trade with a below average transaction quality (above average cost) relative to its peer group will have a rank below the 50th percentile. The average percentile is then calculated for the entire portfolio. The benefit of this method is that it normalizes the data, making all costs relative to an appropriate benchmark. This facilitates comparisons across trades with differing characteristics.
Choosing between list trading and portfolio trading involves reconciling the central tension that exists between the two trading protocols. List trading is an exercise in cherry picking liquidity from multiple providers in competition for each line item. Liquidity providers can even be optimized by line item to align bond characteristics with liquidity provider strengths or risk appetites. In theory this maximizes competition at the lowest level and should produce the best overall outcome. But there are inefficiencies involved as search costs can be high and some line items will be less desirable than others, making them hard or even impossible to trade. Portfolio trading solves this problem by seeking liquidity on the package as a single unit. Counterparties who view the whole as greater than the sum of its parts are put into competition. Execution on the entire portfolio happens all at once, easing the operational burden, the execution risks, and the opportunity costs of incomplete trades.
Our analysis shows that historically the trades that have been executed as portfolios have had lower trading costs than those that have not. That is not enough evidence to say definitively that portfolio trading is more cost effective than list trading because we have no counter factual. Perhaps the portfolios could have been executed even more effectively as lists. We will never know. But the relative cost advantage of portfolio trading is suggestive.
Supply and Demand
Portfolio trading pricing appears to exhibit classic characteristics of supply and demand. However, only one of those two dynamics, demand, can be observed directly. And as we have seen, the demand for portfolio trading has grown consistently since FINRA began disseminating the portfolio trading flag on individual transactions. The other dynamic, supply, can only be inferred from pricing.
In a market where supply and demand are in equilibrium, either growing or shrinking at the same pace or remaining unchanged, prices can be expected to be very stable. But in a market where demand is outpacing supply, or where supply is shrinking while demand is stable or growing, the imbalance can be expected to cause prices to increase.
Portfolio trading’s pricing advantage is slipping at the same time usage has grown. When the FINRA flag was first disseminated in 2023, the average execution quality of portfolio trades was in the 57th percentile. But that percentile rank has slipped ever since. By the first quarter of 2025 portfolio trade pricing was still better than average, in the 53rd percentile. This can be told as a supply / demand story. We know that demand has grown, and we can theorize that supply has not kept pace given the pricing pattern we observe.
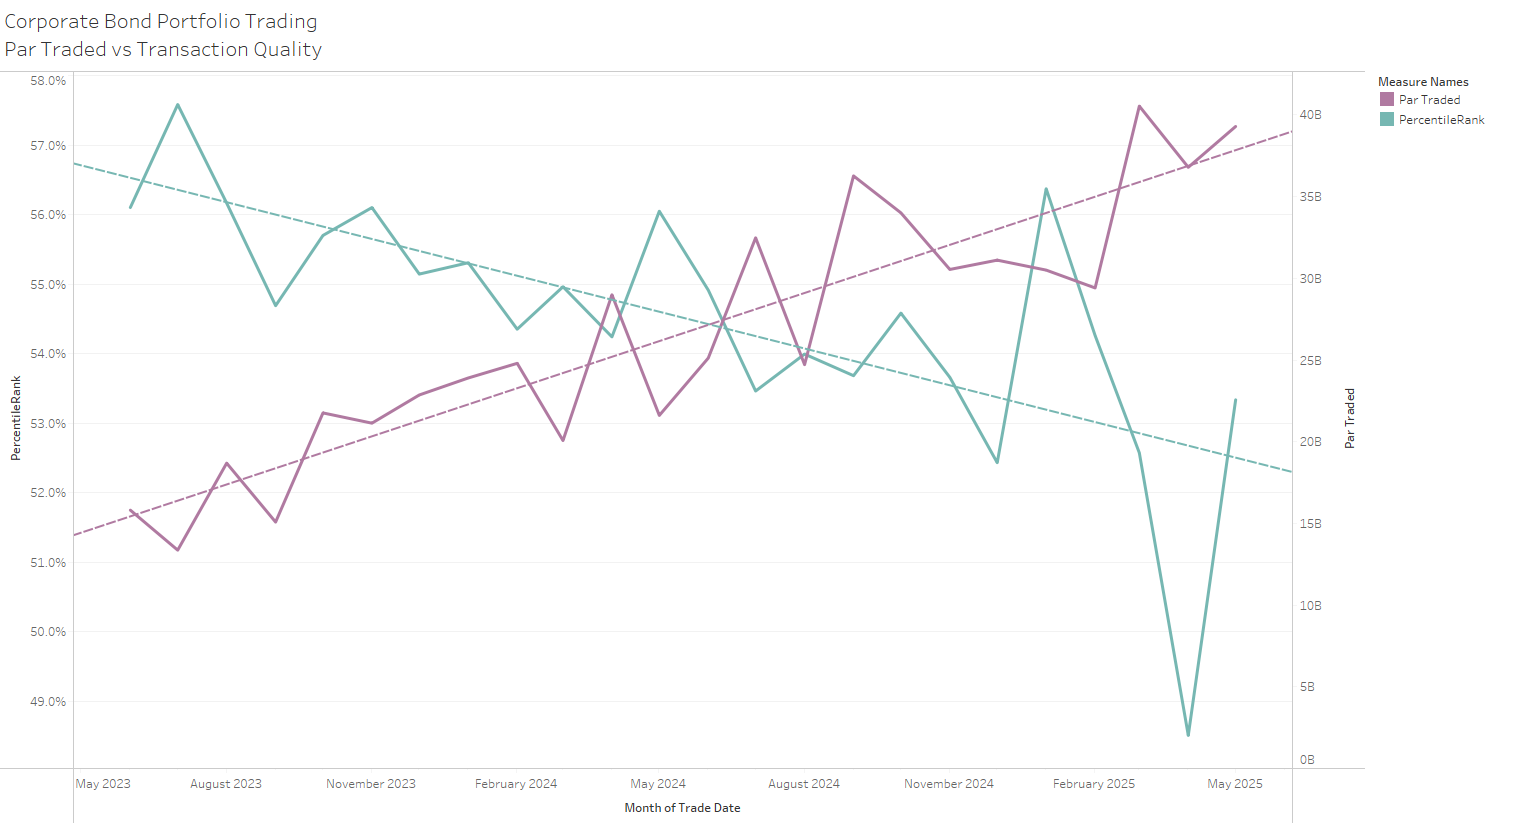
But, then a more drastic change occurred in April 2025. In the first two months of the second quarter portfolio trading constituted nearly 18% of all customer trading, setting a record for volume percentage. While portfolio trading volume continued to grow, transaction quality in April slid below average for the first time to the 47th percentile. This is noteworthy.
Given the steady decline in transaction quality of portfolio trades it appears that there is a supply / demand imbalance in the marketplace. And given the tariff-driven volatility in April, it appears this imbalance was taken to a new level as liquidity providers either exited the market or at least adjusted their pricing significantly to account for the uncertainty about overnight and intra-day policy changes. With relative tariff stability in May the market for portfolio trades appears to have returned to its prior trend, still lower than historical transaction quality but also still above average.
Maturing Price Discovery
Another possible explanation for the general trend of execution quality reverting toward the mean is a maturing price discovery process. In a new market there is often an initial phase where participants jockey for position and market share. This can lead to aggressive pricing designed to capture market share. Sometimes these victories can be pyrrhic, causing market makers to lose money in the pursuit of share. Market makers will naturally respond over time by becoming less aggressive. As market makers’ initial exuberance dies down, even with more market makers entering the business, this can lead to less aggressive pricing. If early-stage pricing was too aggressive to be profitable for market makers, it is possible for supply to grow at or above demand and still see pricing degrade. It seems likely that the pricing degradation we are seeing is a combination of supply/demand shifts and maturing price discovery.
Summary
The claims of better transaction quality and greater operational efficiency, lower execution risk, and lower opportunity cost for corporate bond portfolio trading are well supported by an analysis of the transaction cost of portfolio trades relative to the cost of non-portfolio trades grouped into logical peer benchmarks. That relative cost – or transaction quality – has mostly been between the 57th and the 53rd percentile (with the lone exception of April 2025). But the cost advantage has deteriorated over time. It is even possible that the demand for portfolio trading will continue to grow if transaction quality dips below average given the other benefits of the protocol.
Addendum
Portfolio Trade Determination
While FINRA has implemented a field in their disseminated trade data tagging individual trades as being part of a larger portfolio trade, there is no field that ties the individual elements of a portfolio trade together. BondWave attempted to solve this problem using two elements of the trade reporting rules. The first element is how FINRA defines a portfolio trade. Per Rule 6730 (d)(4)(H), a portfolio trade is defined as:
- executed between only two parties;
- involving a basket of corporate bonds of at least 10 unique issues; and
- for a single agreed price for the entire basket.
The second element is the current FINRA requirement that all trades be reported to TRACE within 15 minutes of their execution.
Combining those two elements we then employ a multi-step process for determining discrete portfolios.
Between May 2023 and May 2025, 8,692 portfolios were identified with $638.9 billion total par traded. The par traded estimate is conservative due to FINRA’s policy of capping investment grade trade sizes above $5 million and high yield trade sizes above $1 million. There were 23,101 (1.7%) trades above $5 million.
The average portfolio contained 166 bonds with a range from as few as 10 bonds to as many as 6,585 bonds. The totals are very skewed to the low end with 61.6% of portfolios (5,354) containing fewer than 100 bonds and 78.7% of portfolios (6,841) containing fewer than 200 bonds.
ABOUT BONDWAVE LLC
Founded in 2001, BondWave® is a financial technology company focused on fixed income solutions that empower our clients to more efficiently manage and grow their fixed income business. We serve a wide range of clients, including traders, compliance professionals, RIAs, and asset managers, who use our tools to provide a superior fixed income experience to their clients while supporting critical regulatory mandates and optimizing workflows.
Effi®, our Engine for Fixed Income, is the single platform through which we deliver all our solutions – providing intuitive dashboards and insights into every fixed income position and transaction to drive informed investment and business decisions. Effi’s capabilities include Portfolio Oversight, Trade Oversight, and curated Muni News. Our solutions are fueled by proprietary data sets that are developed using AI, machine learning technologies, and advanced data science.
This material has been prepared by BondWave LLC (BondWave) and reflects the current opinion of the authors. It is based on sources and data believed to be accurate and reliable but has not been independently verified by BondWave. Opinions and forward-looking statements are subject to change without notice. The material does not constitute a research report or advice and any securities referenced are for illustrative purposes only and not a recommendation to buy or sell any security.
