
Trade Insights – Volume 26
The Federal Reserve steadily slashed interest rates towards the end of 2024 and 2025, but at its latest meeting, the Fed decided to increase interest rates for the first time in three years. This, along with the recent upward trend in Treasury rates, is a good reason for us to take a closer look at the relative movement in municipal yields.
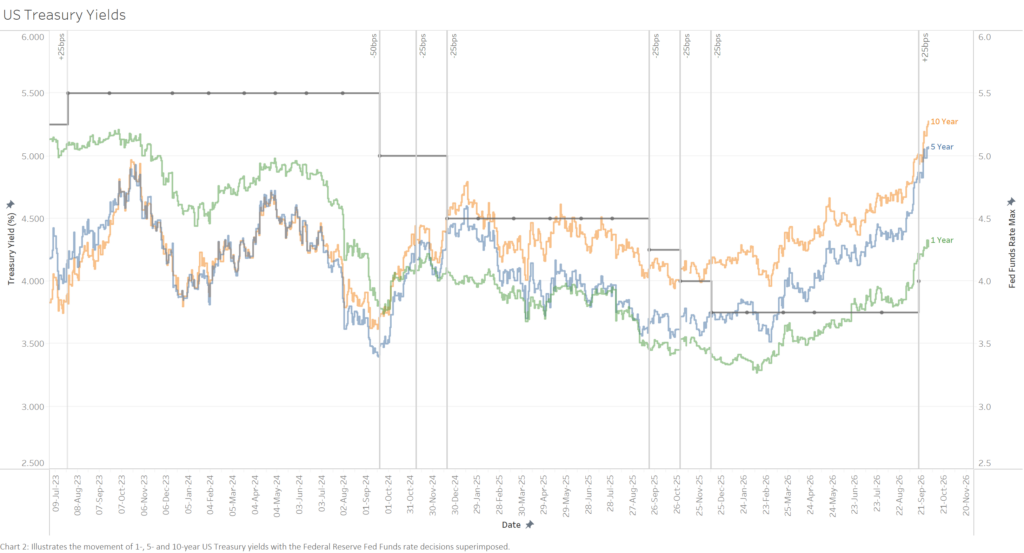
In this piece, we will explore how municipal yields, as measured by the BondWave Municipal AA QCurve, have moved in tandem with the U.S. Treasury yield curve and how the Federal Reserve’s rate policy has impacted its term structure.
In July 2022, the U.S. Treasury curve inverted between the 1- to 5-year range. Municipal yields experienced the same inversion a little later that year, starting in December 2022. Simultaneously, both yield curves remained relatively flat between the 5- to 10-year range.
The first signs of the inversion reversing its course emerged in Q4 of 2024, along with the Federal Reserve reducing rates by 50 bps in September 2024, 25 bps in November 2024, and by another 25 bps in December 2024. Both yield curves flattened in the 1- to 5-year range during this time and began steepening in the 5- to 10-year range. It is worth noting that while the U.S. Treasury term structure returned close to its typical upward sloping shape in Q4 2024, municipal yields took almost another year to follow suit.
Chart 1: BondWave Municipal AA QCurve 1-, 5- and 10-Year Yields Time Series (July 2023 – Present)
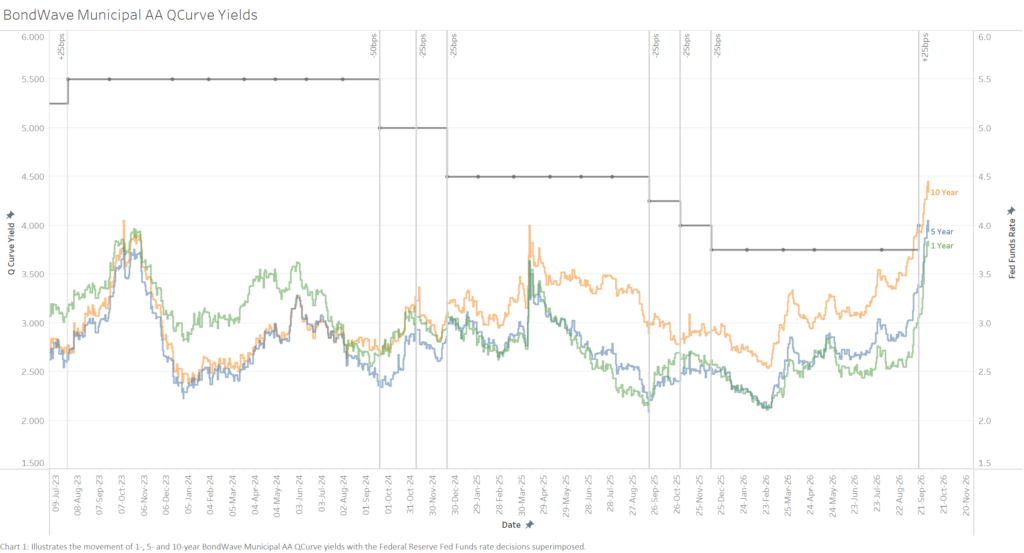
Chart 2: US Treasury Yields 1-, 5- and 10-Year Yields Time Series (July 2023 – Present)
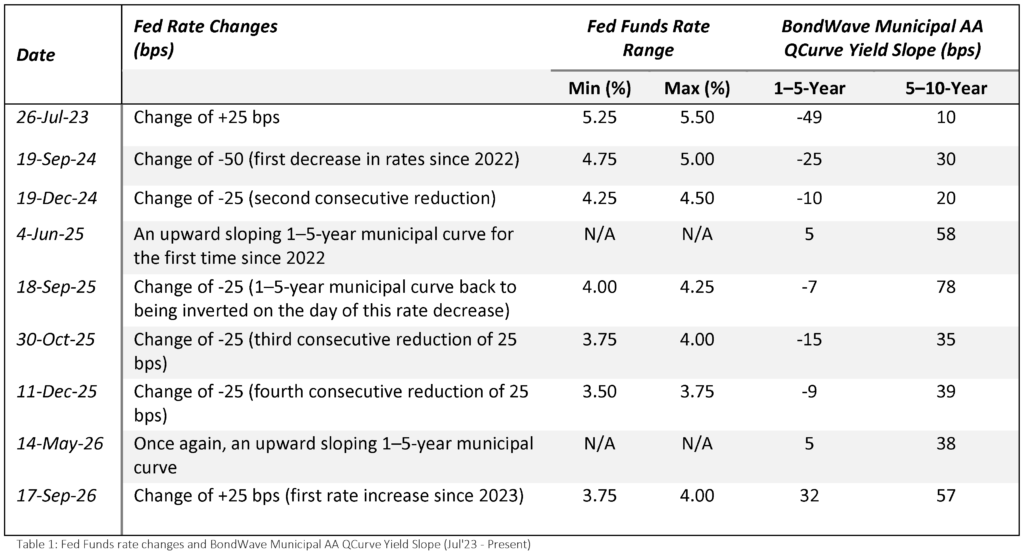
The 1–5-year section of the BondWave Municipal AA QCurve remained inverted until June 4, 2025, when it became upward sloping for the first time since 2023 (Table 1). This change was short-lived, and on the day of the Fed’s third consecutive rate cut, the 1- to 5-year range of the municipal yield curve inverted again (at -7 bps). The whole municipal term structure has remained upward sloping since May 14, 2026.
Table 1: Fed Funds Rate Changes and BondWave Municipal AA QCurve Yield Slope (July 2023 – Present)
Traditionally, munis are more expensive relative to Treasuries, with a typical Muni/Treasury ratio of 70%-80%. In recent years, that ratio has stayed near or below those values. Interestingly, since Q4 2025, 1-year munis have consistently been more attractive than the 5-year munis (and even the 10-year munis at times) compared to their respective U.S. Treasury counterparts. This is indicated by the higher 1-year Muni/Treasury ratio (Chart 3).
Chart 3: Muni/Treasury Ratio at 1-, 5- and 10-Years Time Series (July 2023 – Present)
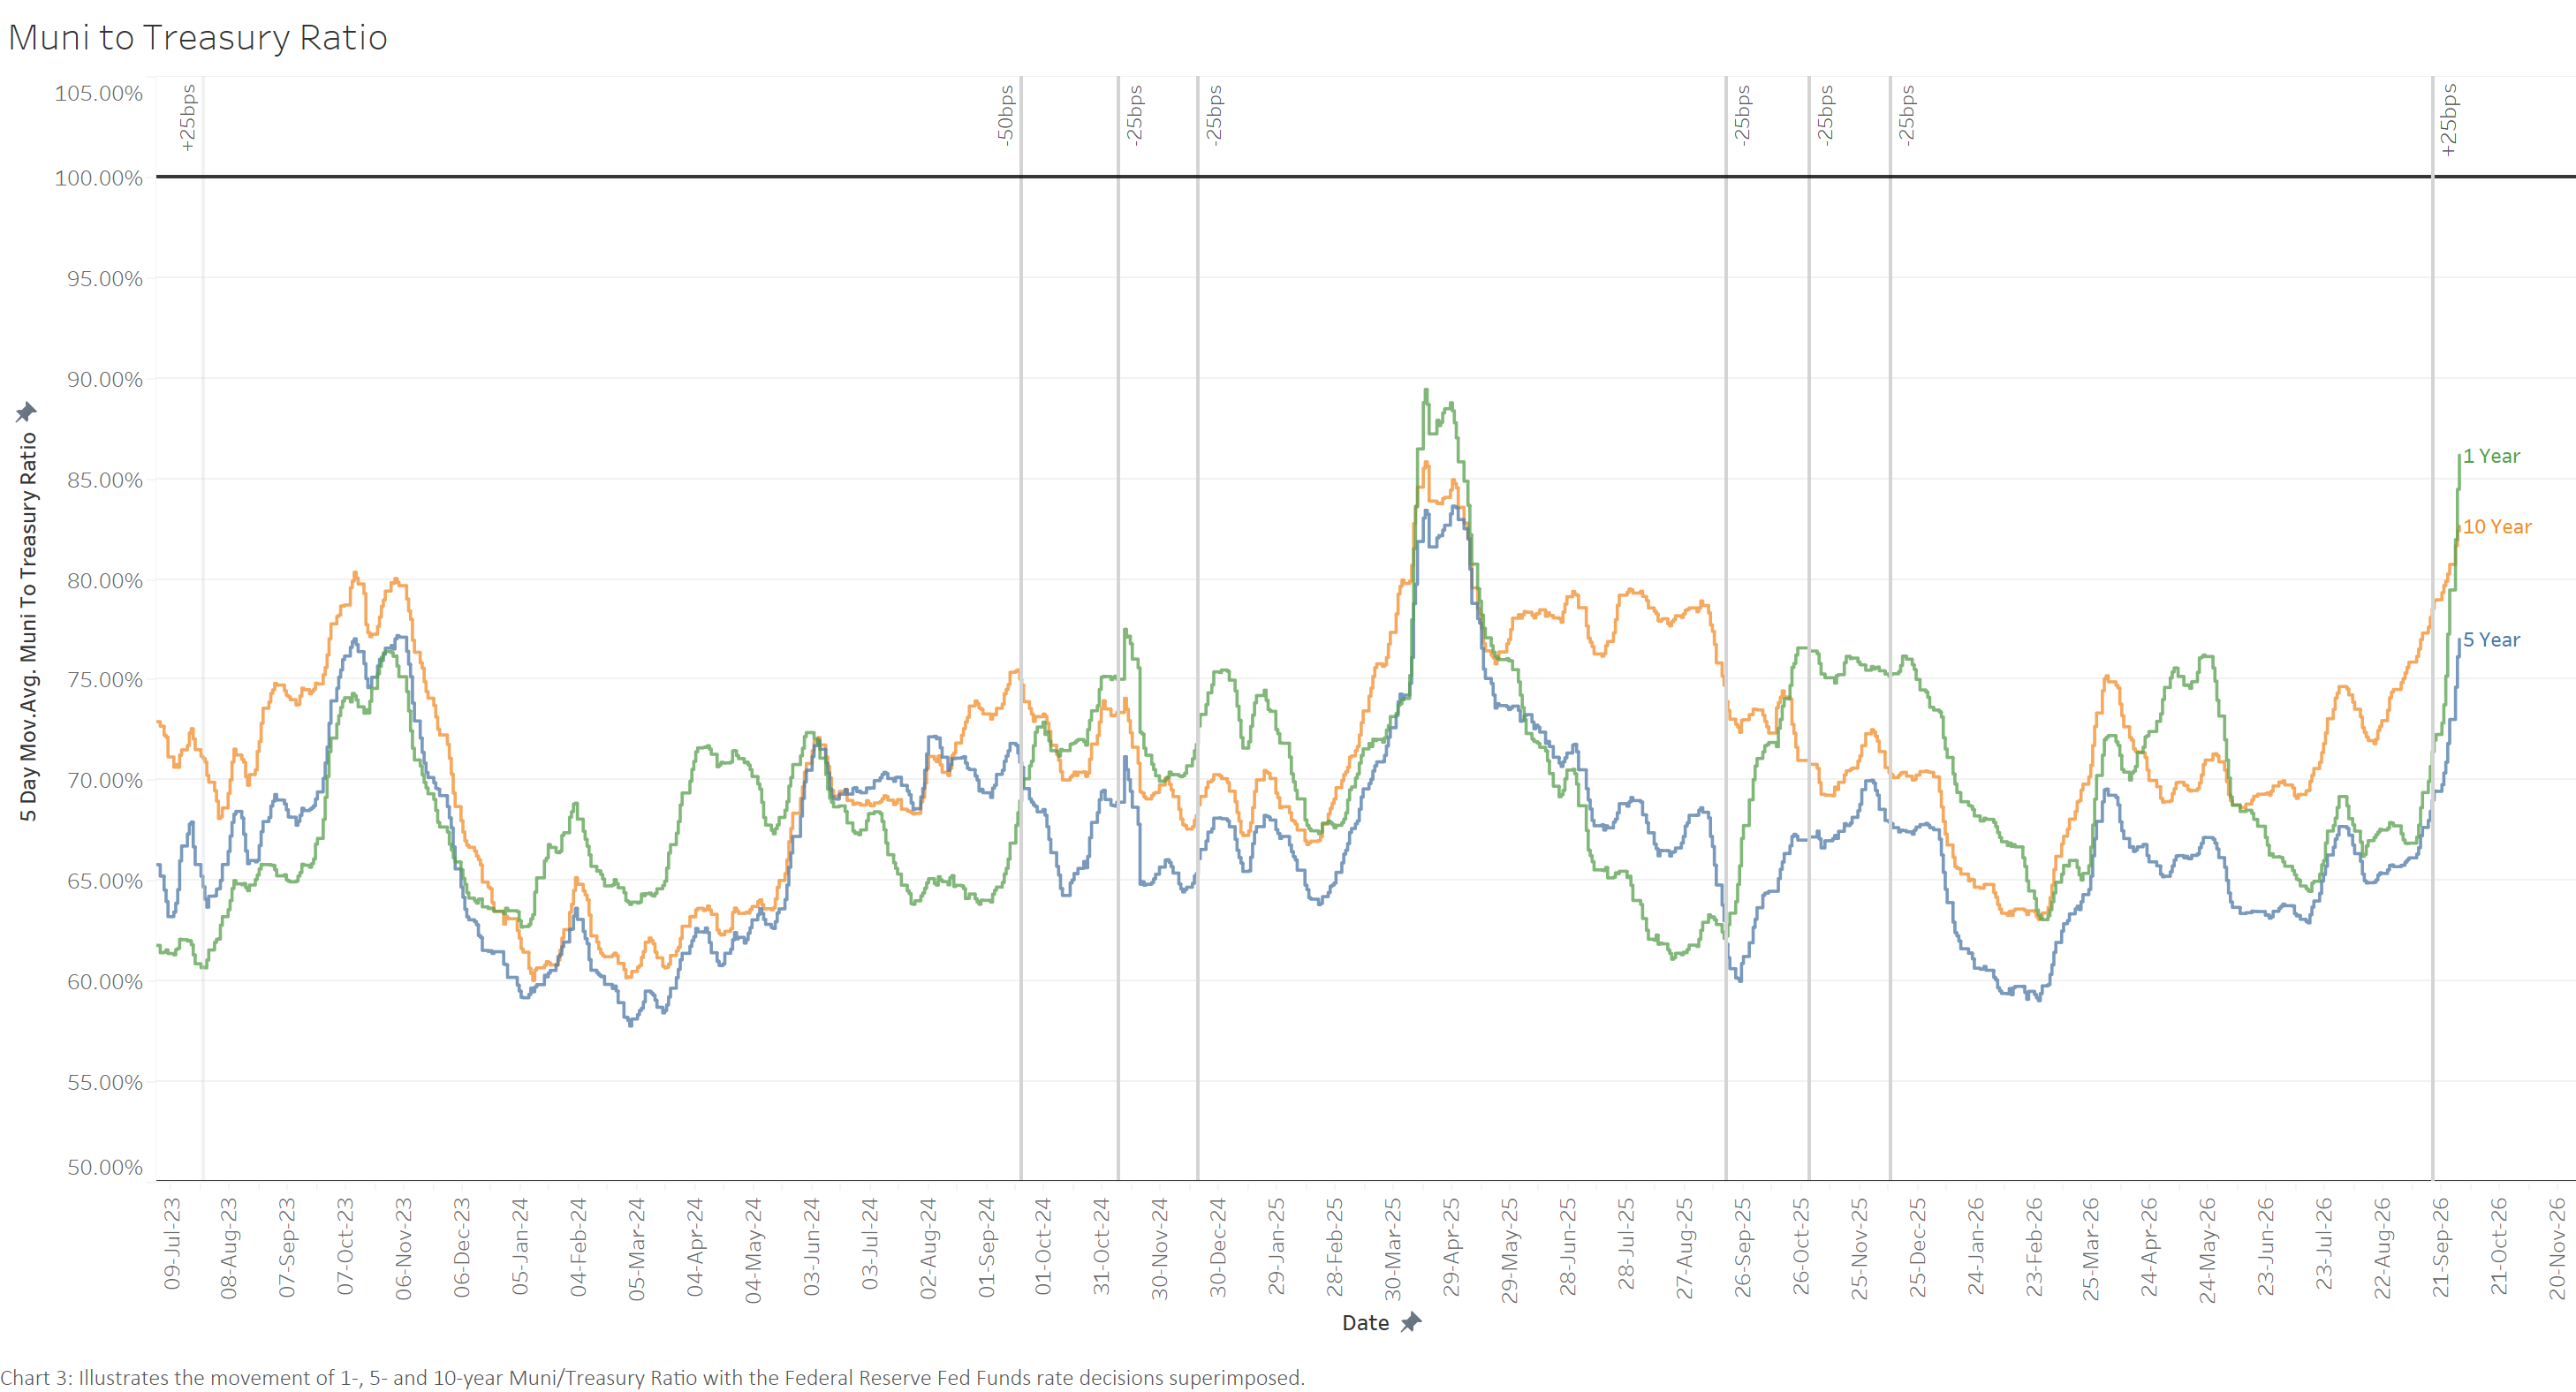
The data points to a shift in relative value toward the front end of the muni curve – the short end of the muni curve currently offers more value than intermediate maturities. This divergence across maturities is worth monitoring, and whether this trend persists will highly depend on the future path of U.S. Treasury rates as well as the underlying fiscal health of municipal issuers.
ABOUT BONDWAVE LLC
Established in 2001, BondWave® is a financial technology firm specializing in fixed income solutions designed to enable clients to manage and expand their fixed income business with greater efficiency. We serve a wide range of clients, including traders, compliance professionals, RIAs, and asset managers, who use our tools to provide a superior fixed income experience to their clients while supporting critical regulatory mandates and optimizing workflows.
Effi®, our Engine for Fixed Income, is the single platform through which we deliver all our solutions – providing intuitive dashboards and insights into every fixed income position and transaction to drive informed investment and business decisions. Effi’s capabilities include Portfolio Oversight, Trade Oversight, and curated MuniNews. Our solutions are fueled by proprietary data sets that are developed using AI, machine learning technologies, and advanced data science. To learn more about BondWave, visit bondwave.com.
This material has been prepared by BondWave LLC (BondWave) and reflects the current opinion of the authors. It is based on sources and data believed to be accurate and reliable but has not been independently verified by BondWave. Opinions and forward-looking statements are subject to change without notice. The material does not constitute a research report or advice and any securities referenced are for illustrative purposes only and not a recommendation to buy or sell any security.