Trade Insights – Volume 25
The corporate bond market of 2026 looks nothing like the corporate bond market of 2016, and while there have been several forces at work in that transformation, the single greatest force may be the introduction of portfolio trading. Introduced in 2018 but only identified on TRACE disseminated trades since May 2023, portfolio trading has grown to 20% of customer volume today from just 5% in 2023.
Volume Shifting
Prior to the growth of portfolio trading, the corporate bond market had already begun to organize liquidity around the primary corporate bond indexes published by Bloomberg Barclays. Prior to 2021, those indexes were priced at 3 p.m. ET. From 2016 to 2020, the share of volume that printed at 3 p.m. ET grew each year from 5% in 2016 to 9.1% in 2020.
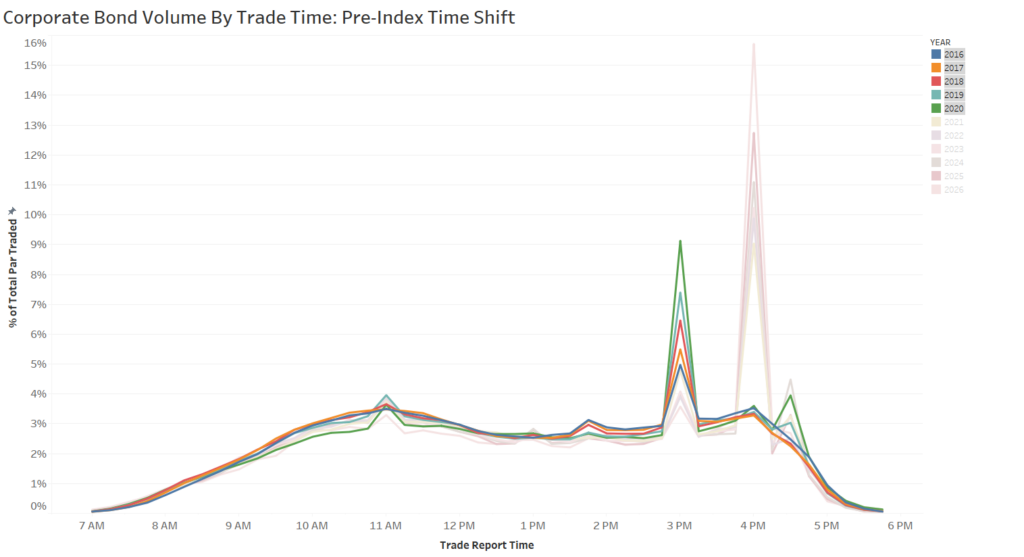
When Bloomberg Barclays changed their index pricing time to 4 p.m. ET on January 14, 2021, the volume immediately shifted to match the index pricing time, establishing the causality.
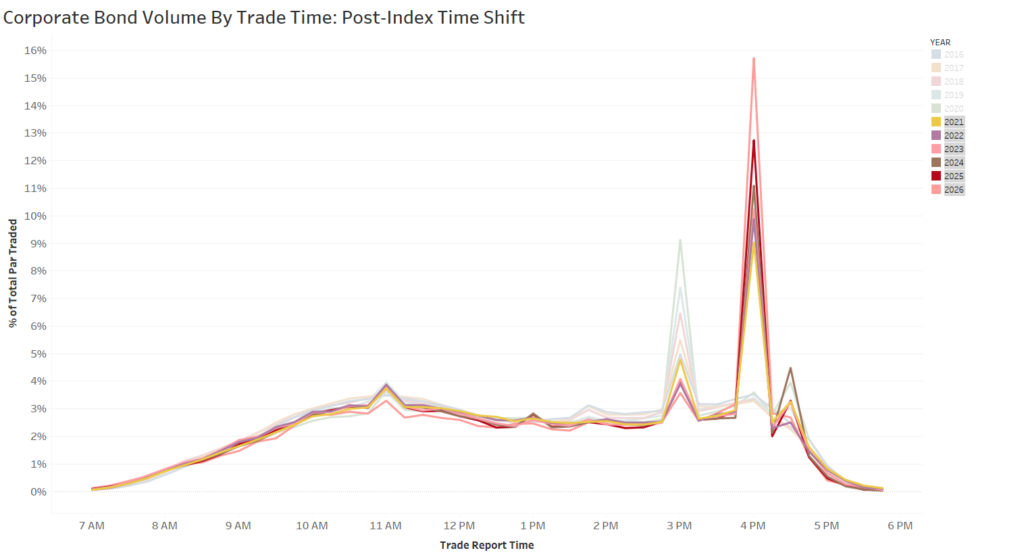
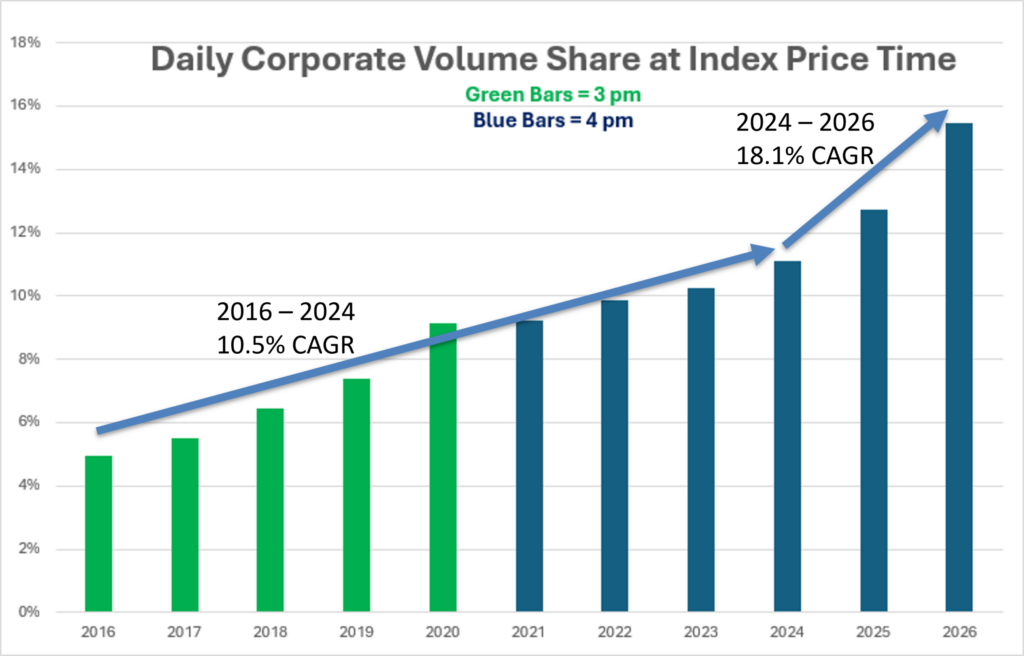
In addition to shifting time, the volume associated with the index pricing time continued to grow, from 9.3% in 2021 to 15.5% in the first quarter of 2026.
Lining up the index pricing times by year reveals a growth trajectory change in 2025. From 2016 through 2024, volume at the index pricing time grew by 10.5% annually. Over the last two years, the compound annual growth rate has jumped to 18.1%. The sudden change in growth suggests there is an additional force at work driving volume to the index pricing time.
The Importance of Portfolio Trading
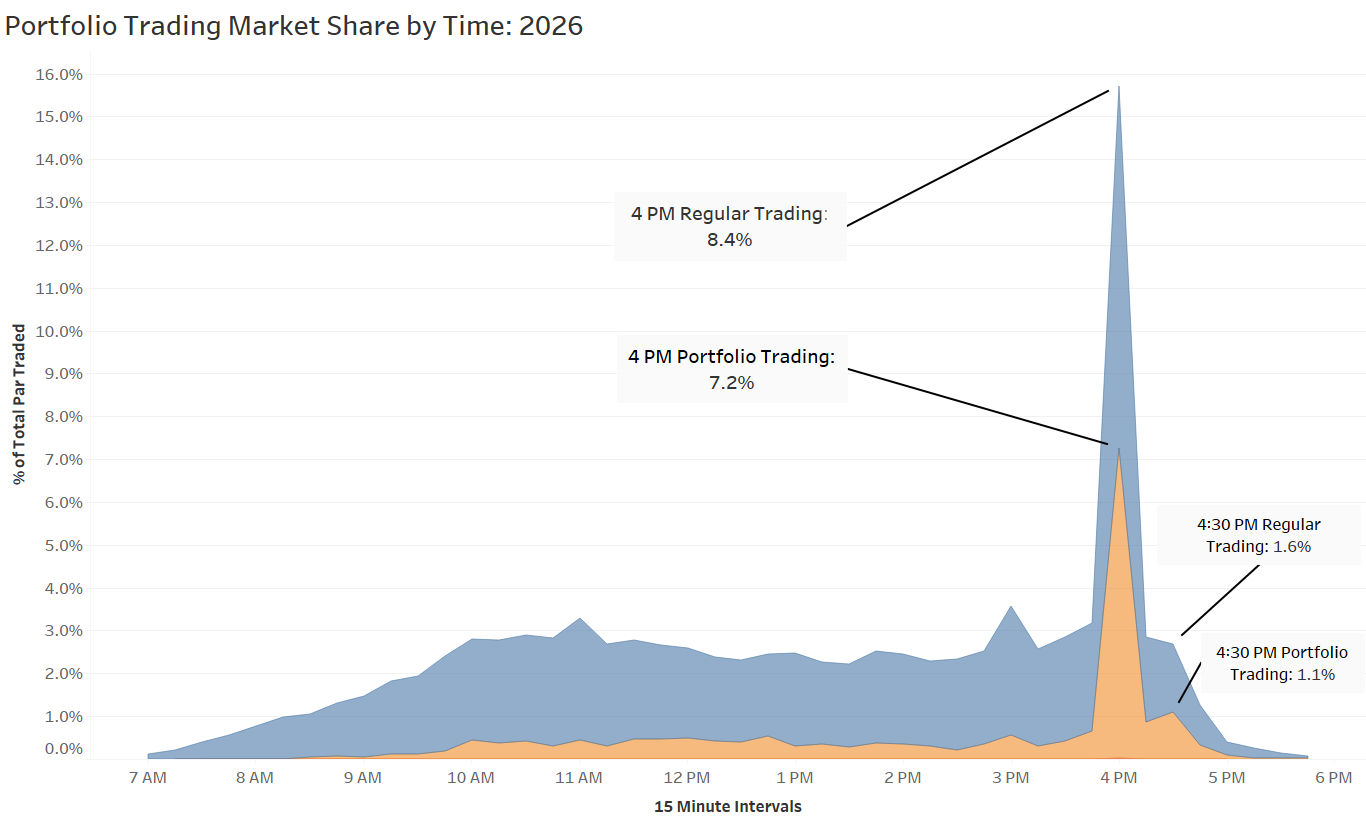
The additional force appears to be portfolio trading. With a 19.8% share of the customer market in the first quarter of 2026, portfolio trading commands a very important place in the market. Additionally, almost half of all portfolio trade volume is printed at, or after, the index pricing time.
Portfolio Trading Pricing
The three main selling points for portfolio trading are that it delivers operational efficiencies allowing traders to execute all trades at once and eliminate opportunity costs, allows illiquid bonds to be executed on par with liquid bonds, and provides superior transaction quality.
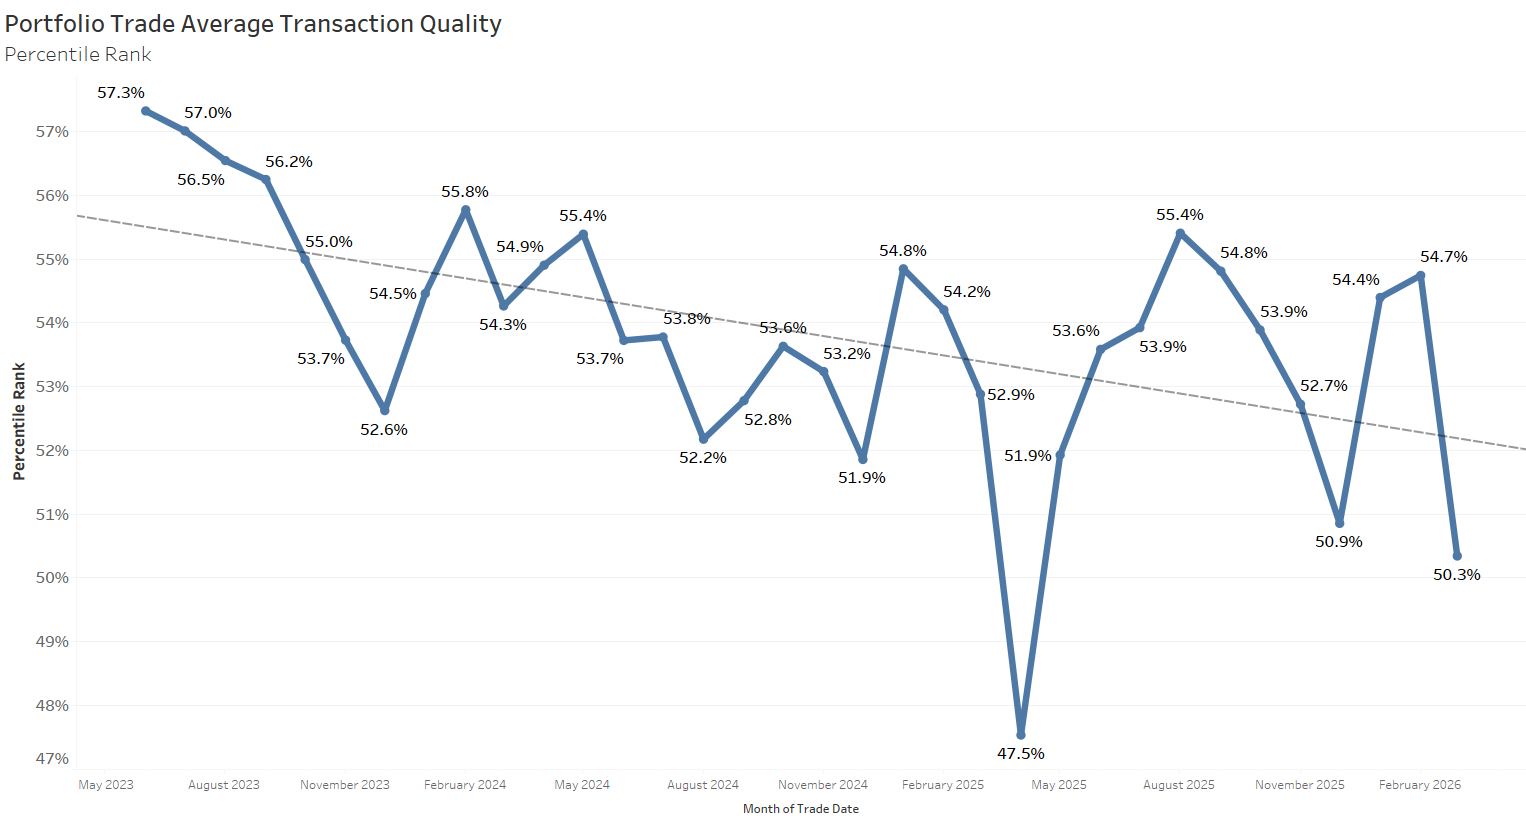
While the first selling point (efficiency) is unchanged, the third (pricing) has begun to deteriorate.[1] Along with the increasing demand for liquidity via portfolio trades has come an equal and opposite impact on pricing. In 2023, portfolio trading costs were superior to non-portfolio trading costs (in the 57th percentile). In 2026, executions slipped to the 50th percentile. Portfolio trades now achieve median execution.
The corporate bond market has undergone a steady, one-way transformation in the past decade. Traders are choosing to align their executions with how their performance is measured. Minimizing price differences to the broad market indexes appears to be a motivating factor for a portion of the shift to printing trades at the same time as the indexes are calculated. Relatedly, the importance of portfolio trading has driven volume to migrate to the same time of day, and as portfolio trading has become more predominant, pricing has become more average.
[1] In a future piece, we will examine the second selling point of portfolio trading—liquidity transformation.
ABOUT BONDWAVE LLC
Founded in 2001, BondWave® is a financial technology firm specializing in fixed income solutions designed to enable clients to manage and expand their fixed income business with greater efficiency. We serve a wide range of clients, including traders, compliance professionals, RIAs, and asset managers, who use our tools to provide a superior fixed income experience to their clients while supporting critical regulatory mandates.
Effi®, our Engine for Fixed Income, is the single platform through which we deliver all our solutions – providing intuitive dashboards and insights into every fixed income position and transaction to drive informed investment and business decisions. Effi’s capabilities include Portfolio Oversight, Trade Oversight, and curated MuniNews. Our solutions are fueled by proprietary data sets that are developed using AI, machine learning technologies, and advanced data science.
This material has been prepared by BondWave LLC (BondWave) and reflects the current opinion of the authors. It is based on sources and data believed to be accurate and reliable but has not been independently verified by BondWave. Opinions and forward-looking statements are subject to change without notice. The material does not constitute a research report or advice and any securities referenced are for illustrative purposes only and not a recommendation to buy or sell any security.
