Developed to help bond market participants better understand trading trends in the fixed income markets, BondWave’s Data Lab has released its QMarksTM dashboards for the first quarter of 2023.
QMarks is a proprietary BondWave data set that powers its quarterly dashboards to cover all disseminated bond transactions using the regulatory-prescribed Prevailing Market Price methodology for corporate, municipal, agency, and 144A. QMarks belongs to a suite of other BondWave proprietary data sets, including QCurves, QTrades, and QScores.
Q1 2023 Observations:
“The municipal bond market reacted very differently to the volatility of Q1 than other bond markets. Whereas corporate bonds (registered and 144A) and agency bonds saw greater activity, the municipal market cooled.” – Paul Daley, Managing Director
Corporate Bond Market Trends
Observations:
- Corporate bonds saw an uptick in trading volume as regional bank concerns drove volatility and trading.
- Par traded increased 23.2% quarter over quarter and 17.5% year over year.
- Q1 2023 has also seen the continuation of another interesting trend. The number of very large corporate trades continues to shrink. FINRA masks the size of any investment grade trade greater than $5,000,000 and any high yield trade greater than $1,000,000. The percentage of trades that are masked is at an all-time low.
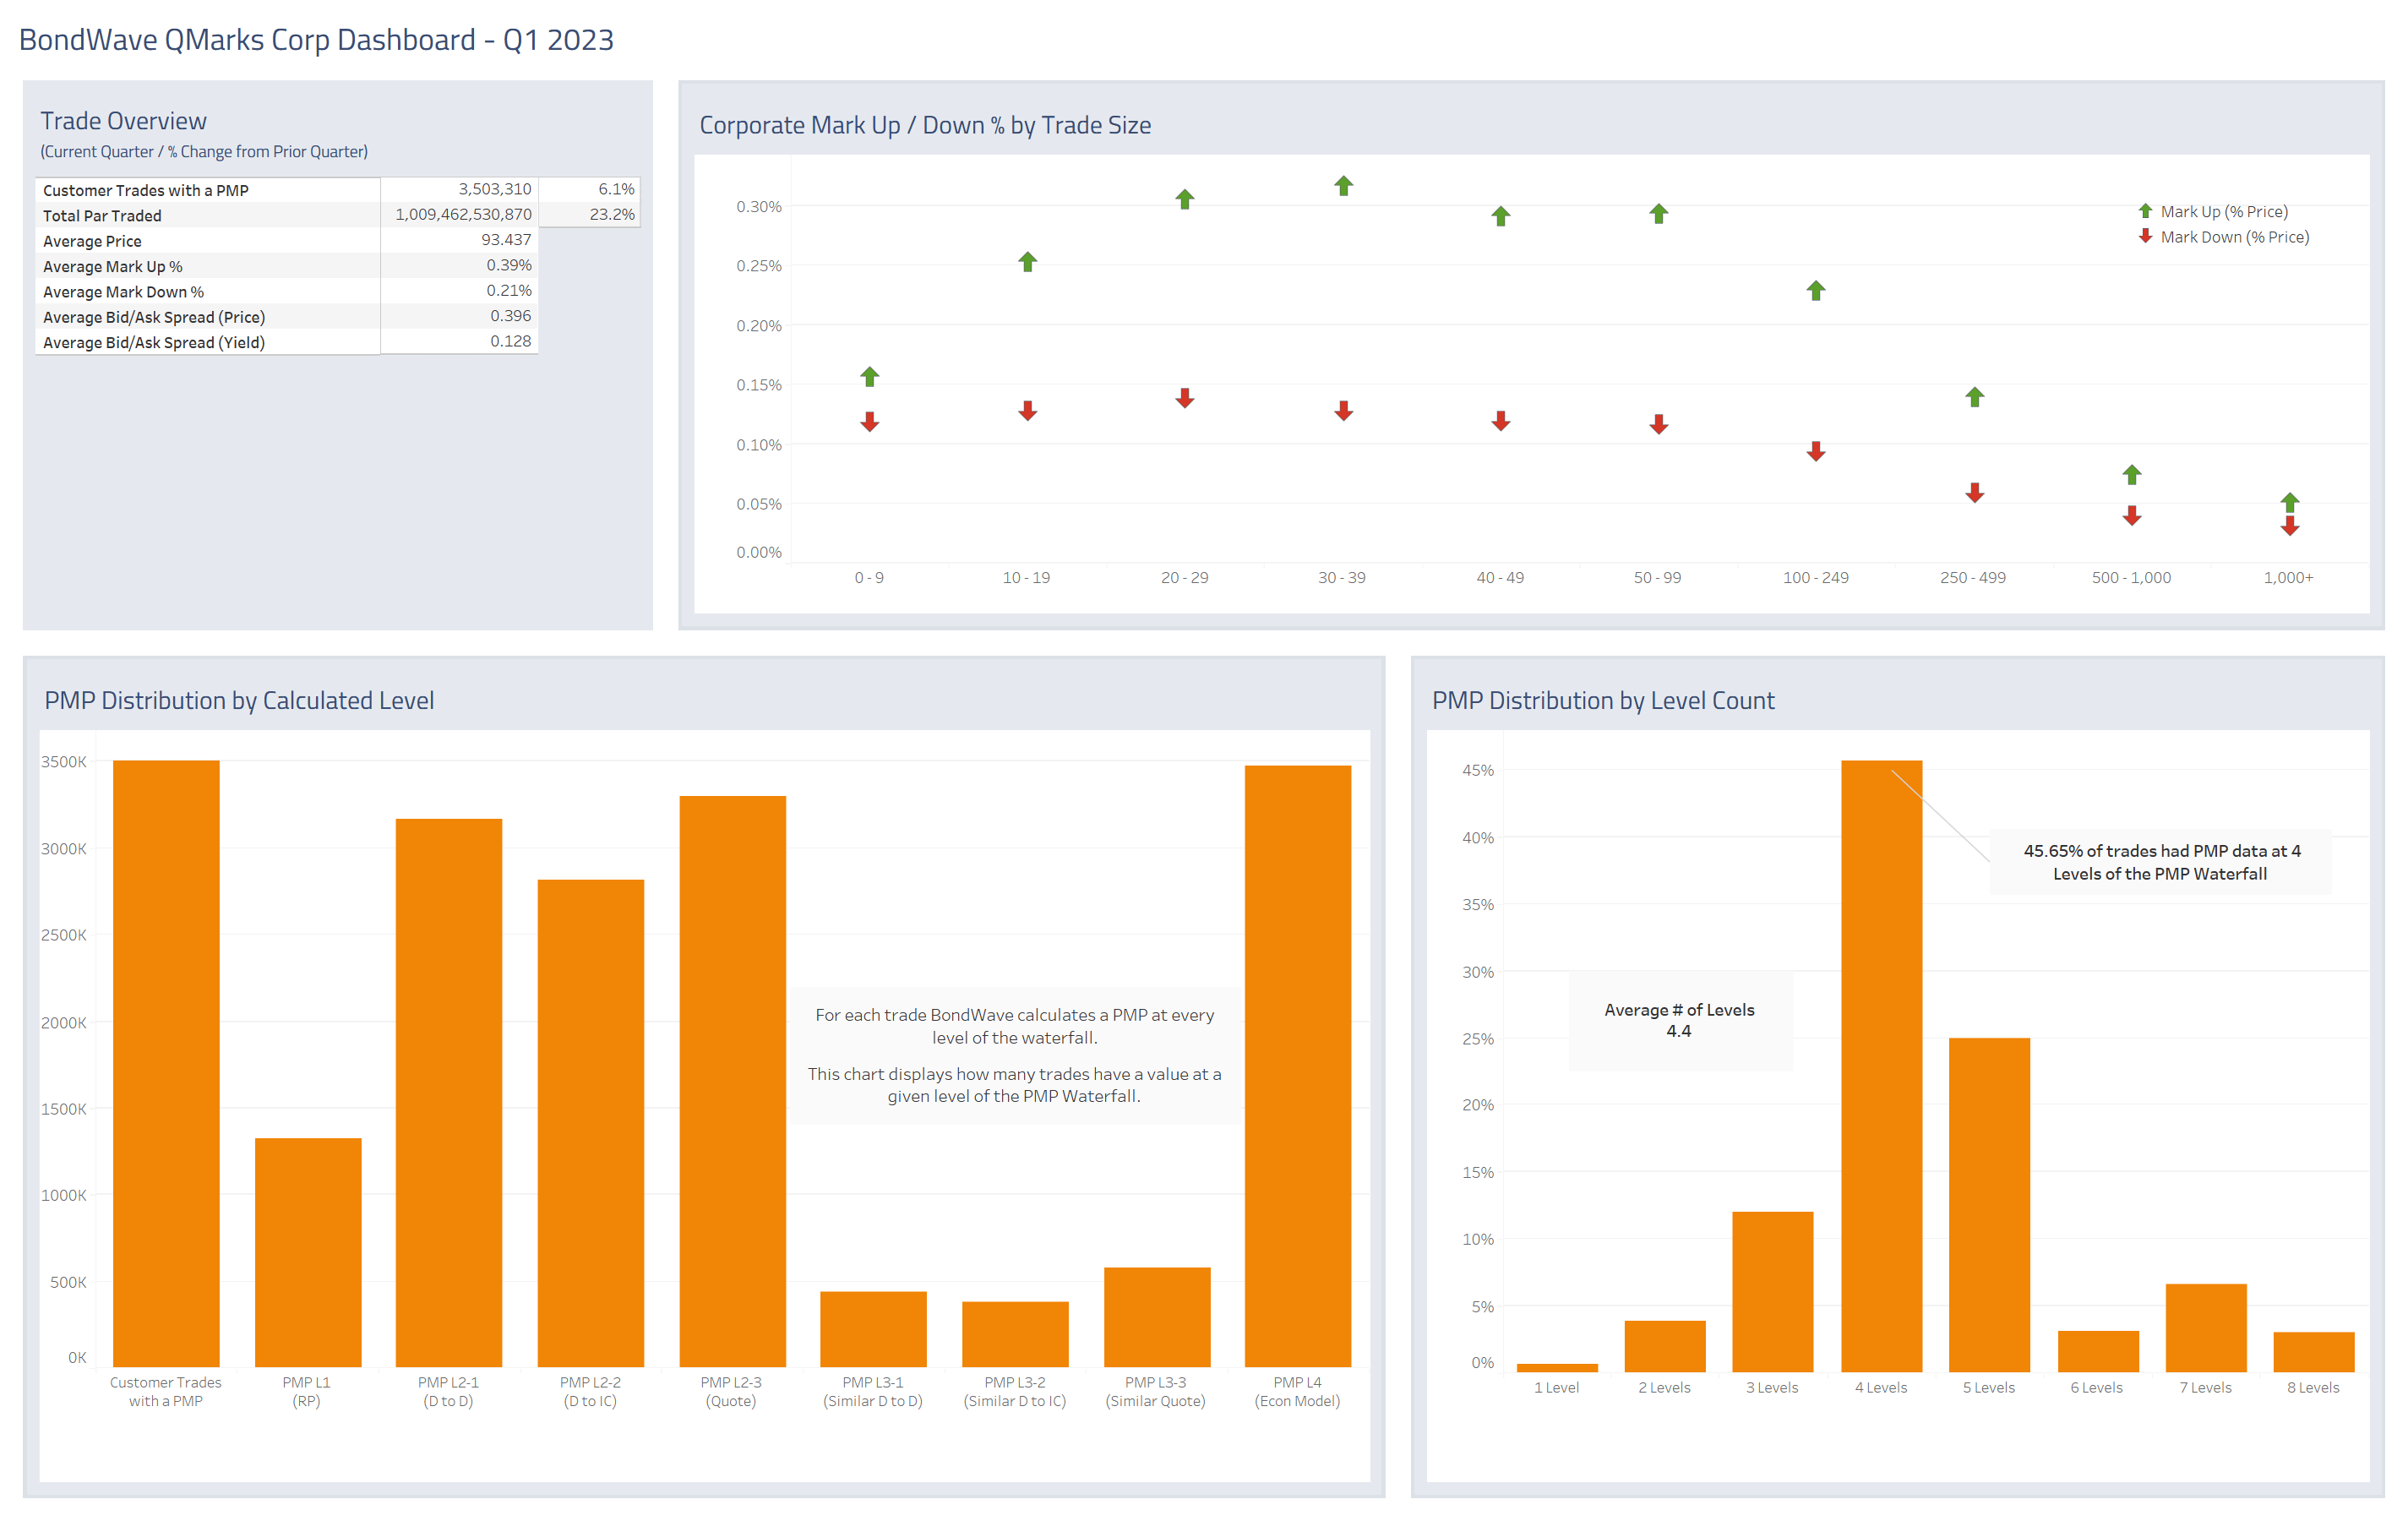
Source: BondWave QMarks
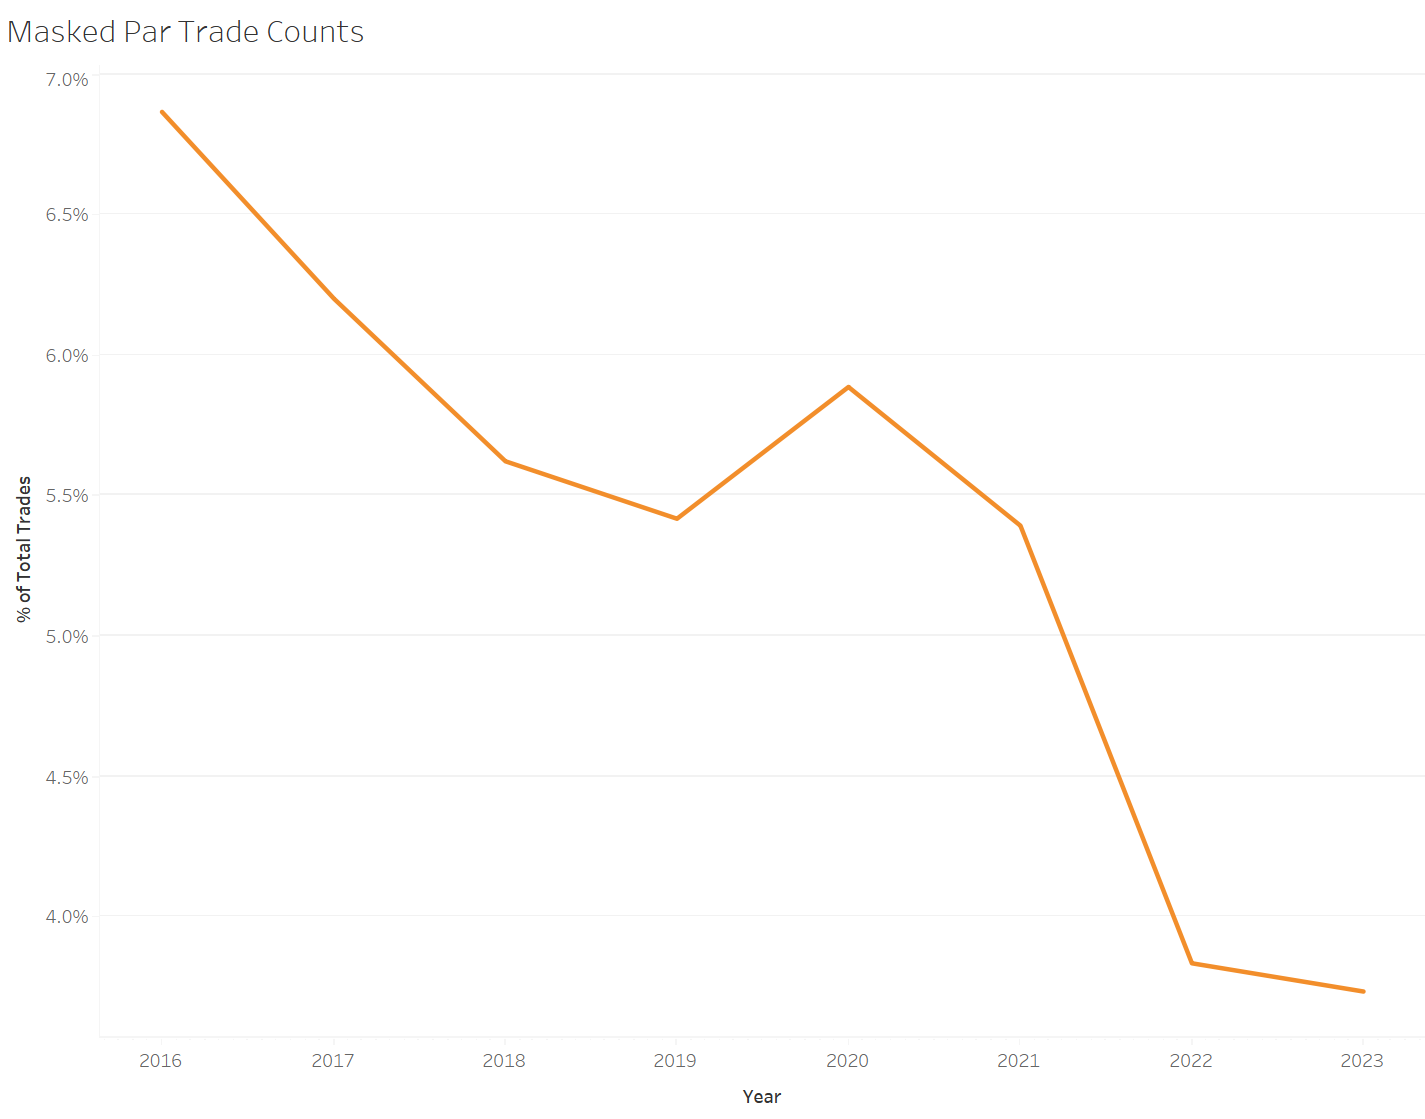
Source: BondWave QMarks
Municipal Bond Market Trends
Observations:
- After a record trading volume year in 2022, the municipal market decreased in activity.
- Par traded was down 21.1% quarter over quarter and down 6.8% year over year.
- Most other measures of municipal trading were unchanged (mark-ups, bid/ask spread).
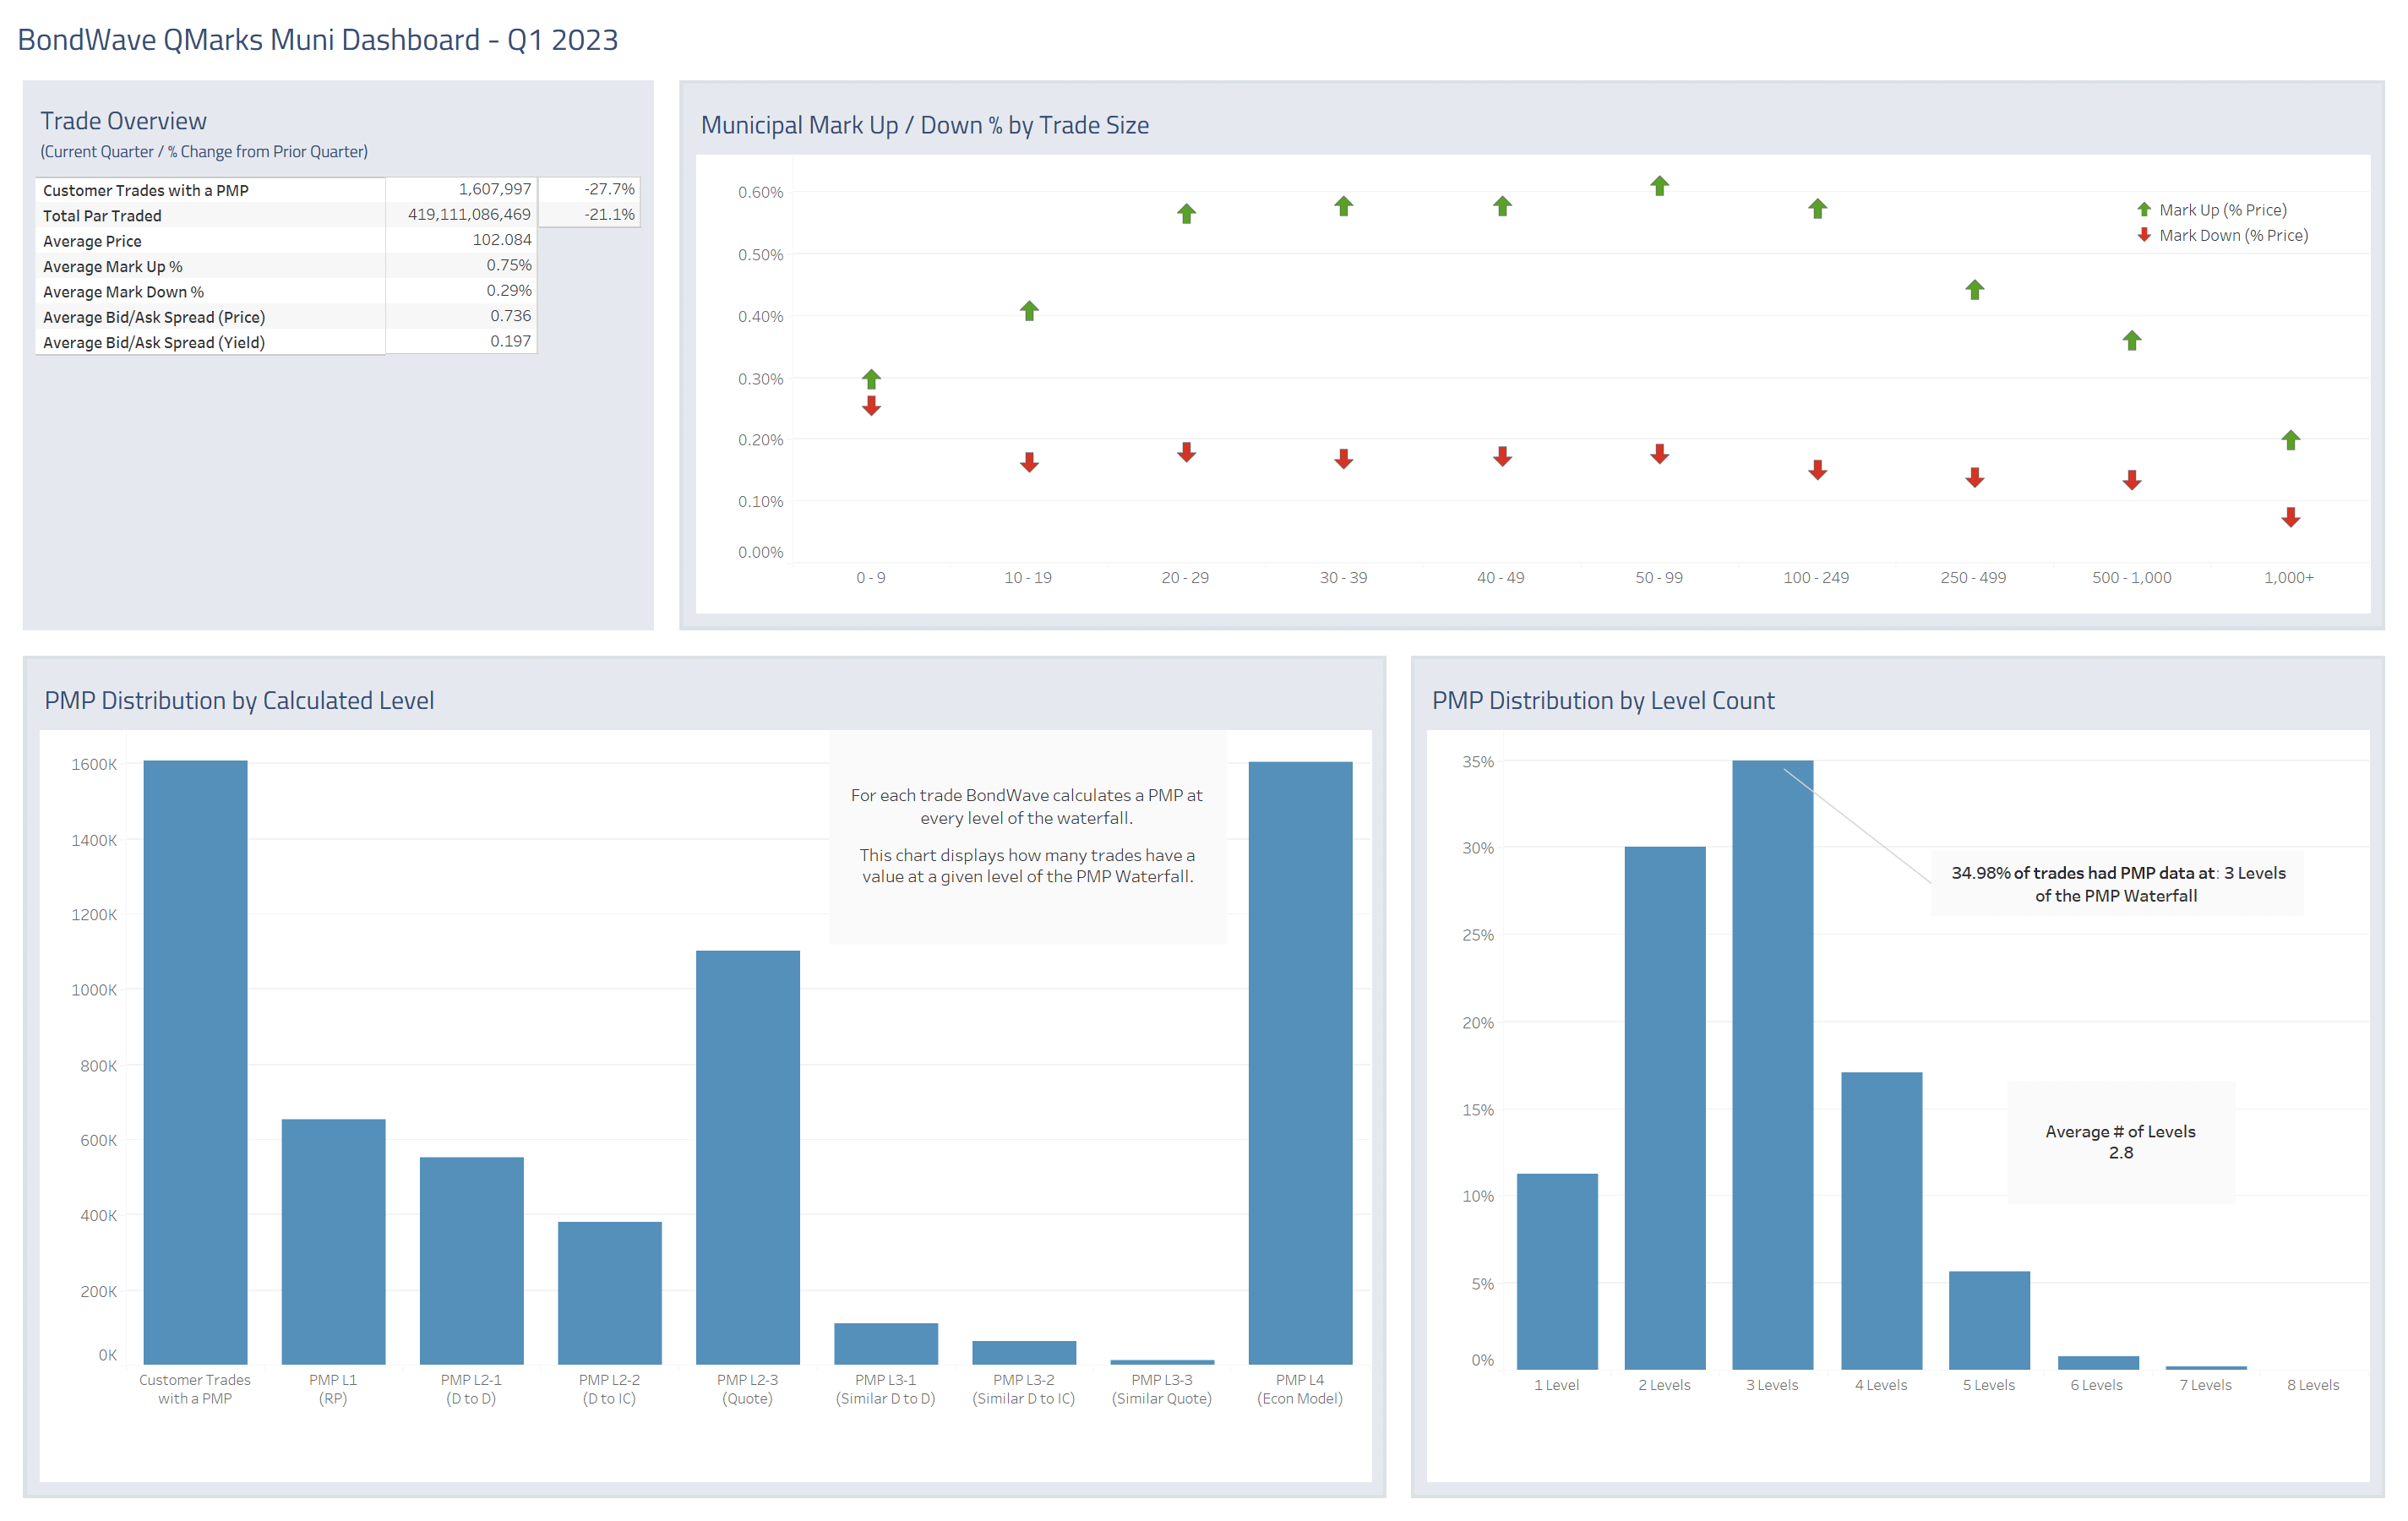
Source: BondWave QMarks
Agency Bond Market Trends
Observations:
- Agency trading volume continues to grow.
- Par traded increased 23.9% quarter over quarter and 14.6% year over year.
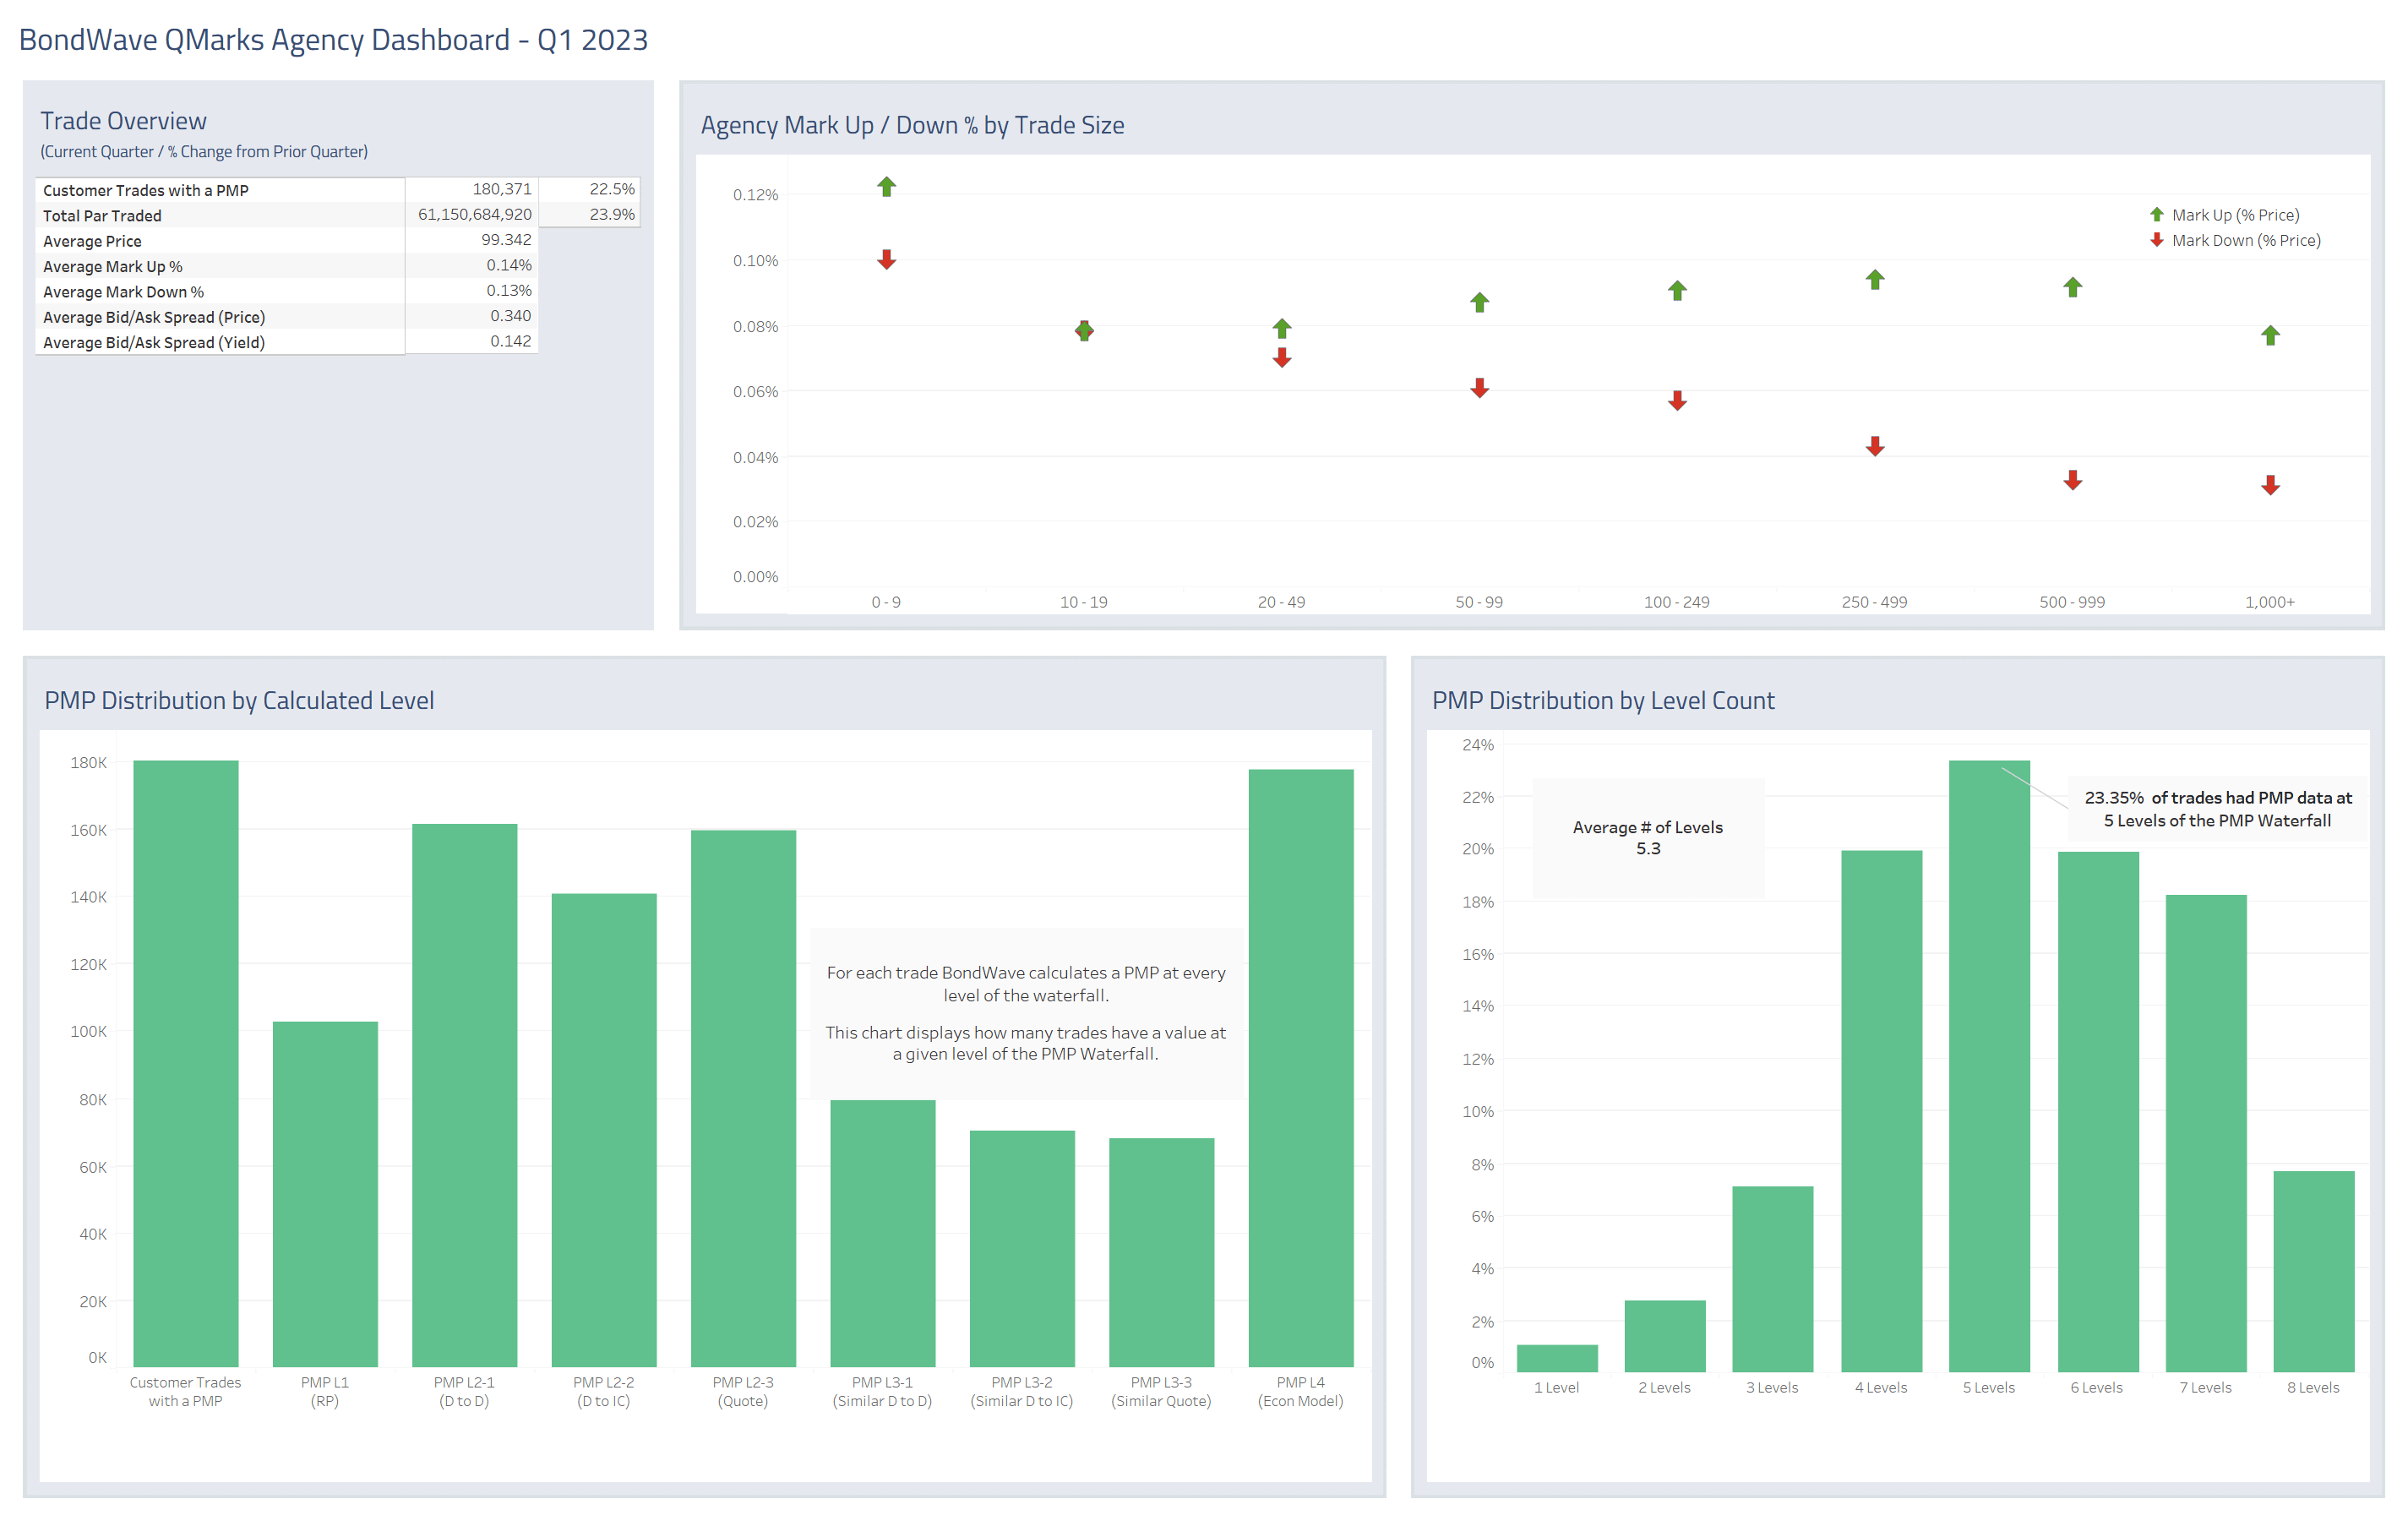
Source: BondWave QMarks
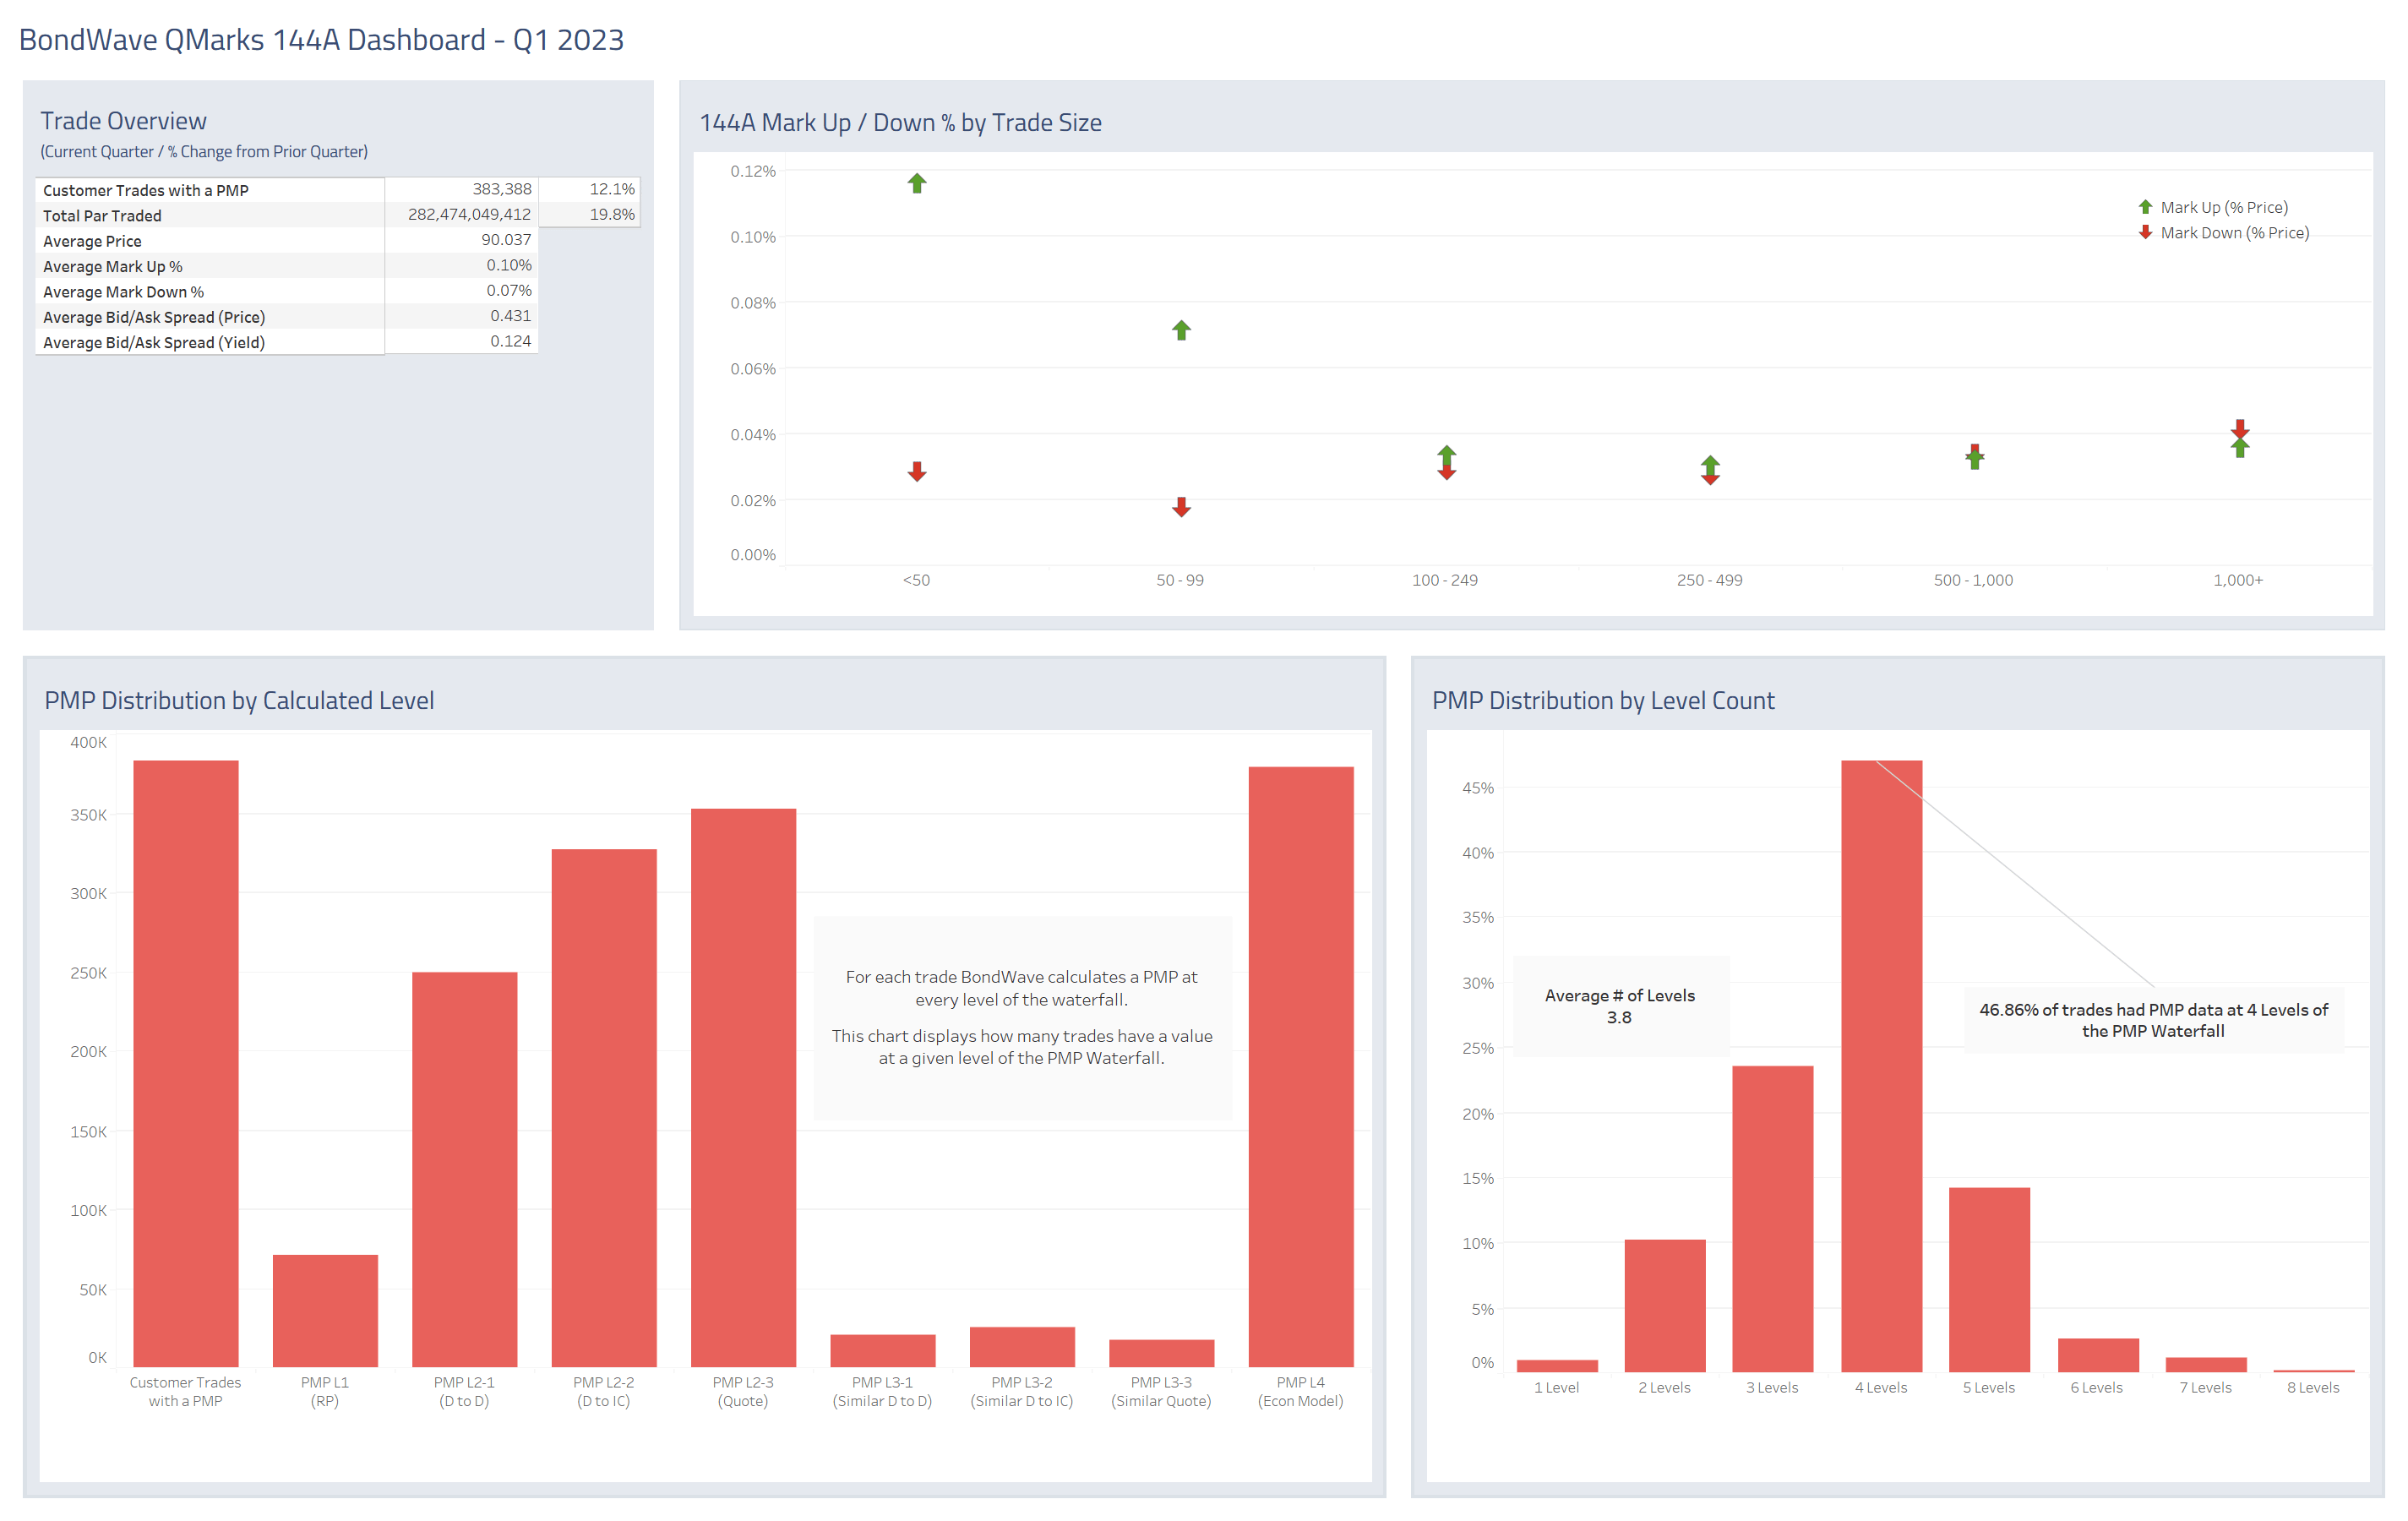
144A Bond Market Trends
Observations:
- Like the registered corporate bond market, 144A bonds saw a jump in volume during the first quarter.
- Par traded increased 19.8% quarter over quarter and 2.90% year over year.
- Q1 2023 only trails Q1 2021 in total par traded.
Source: BondWave QMarks
The dashboards for previous quarters referenced above are located here:
QOQ: Q4 2022 Dashboards
YOY: Q1 2022 Dashboards
