Developed to help bond market participants better understand trading trends in the fixed income markets, BondWave’s Data Lab has released its QMarksTM dashboards for the third quarter of 2024.
QMarks is a proprietary BondWave data set that powers its quarterly dashboards to cover all disseminated bond transactions using the regulatory-prescribed Prevailing Market Price methodology for corporate, municipal, agency, and 144A. QMarks belongs to a suite of other BondWave proprietary data sets, including QCurves, QTrades, and QScores.
Q3 2024 Observations:
Corporate Bond Market Trends
Source: BondWave QMarks
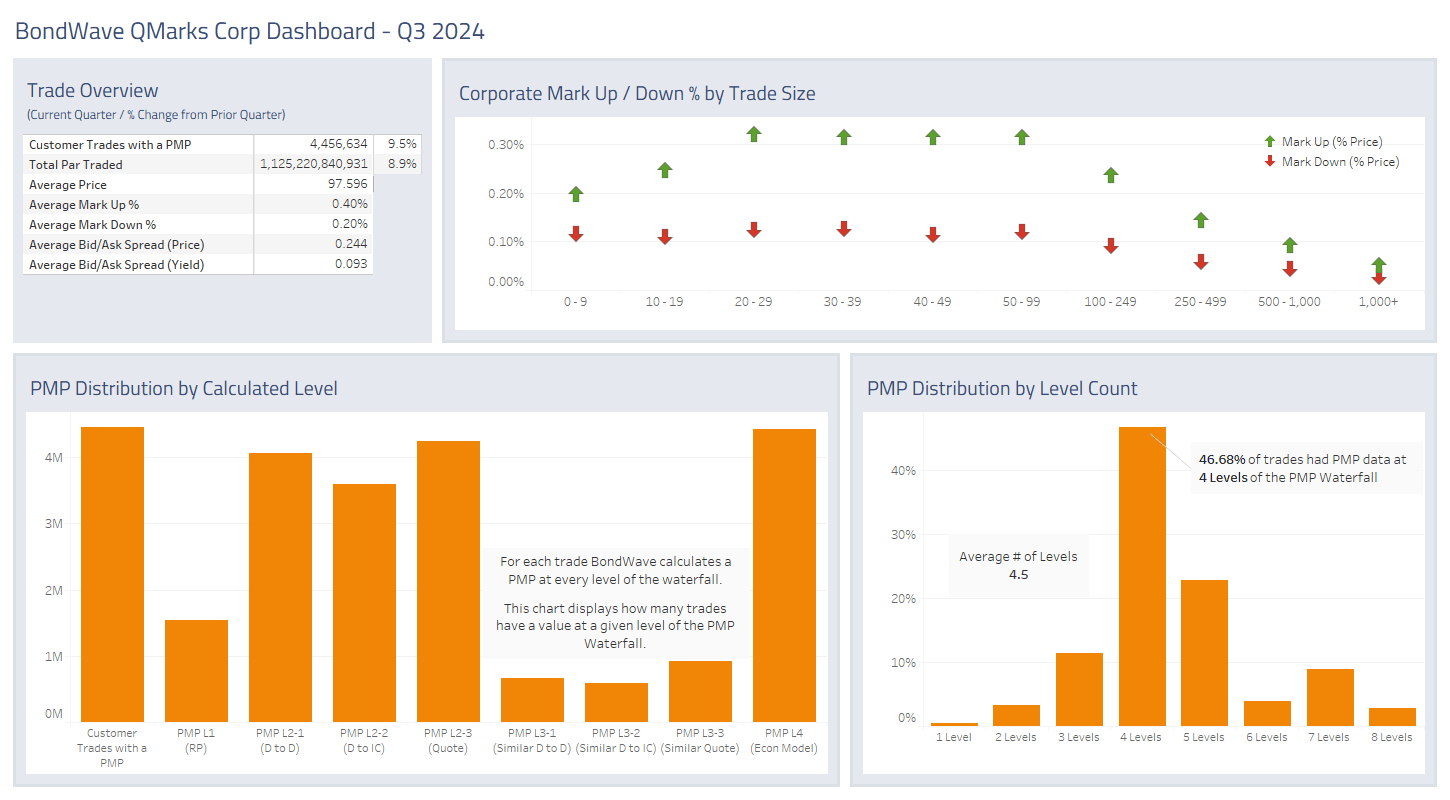
- The corporate bond market saw another jump in customer par value traded in the third quarter. The 8.9% gain pushed the market to a new quarterly par value traded record, barely inching out Q1 2024.
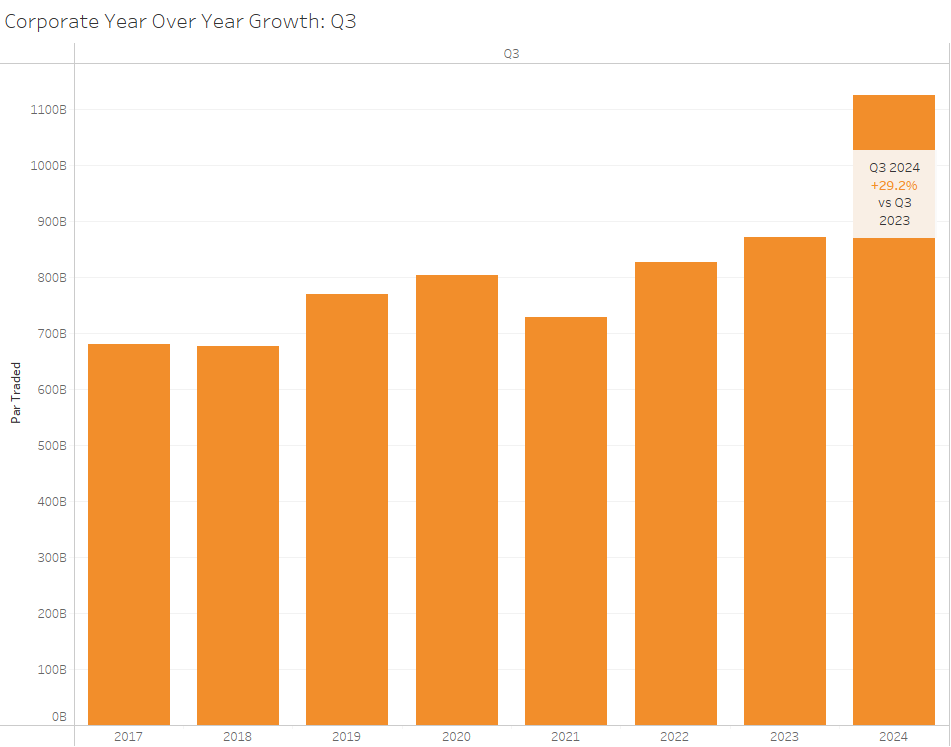
- The par value traded gain looks even more impressive when compared to the same quarter in years past. Q3 2024 par value traded was 29.2% greater than Q3 2023 par value traded.
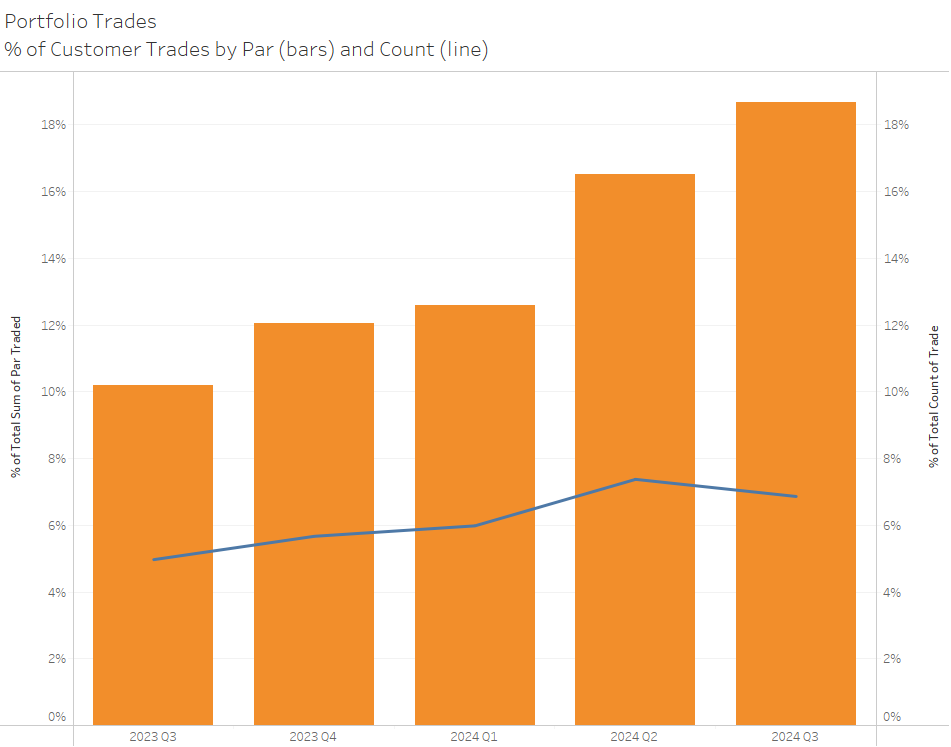
- Portfolio trading continues to be an important driver for the corporate bond market. Portfolio trading is growing faster than the general market and now comprises nearly 19% of customer par value traded.
- Against this backdrop mark ups and mark downs are virtually unchanged.
Source: BondWave QMarks
Source: BondWave QMarks
144A Bond Market Trends
Source: BondWave QMarks
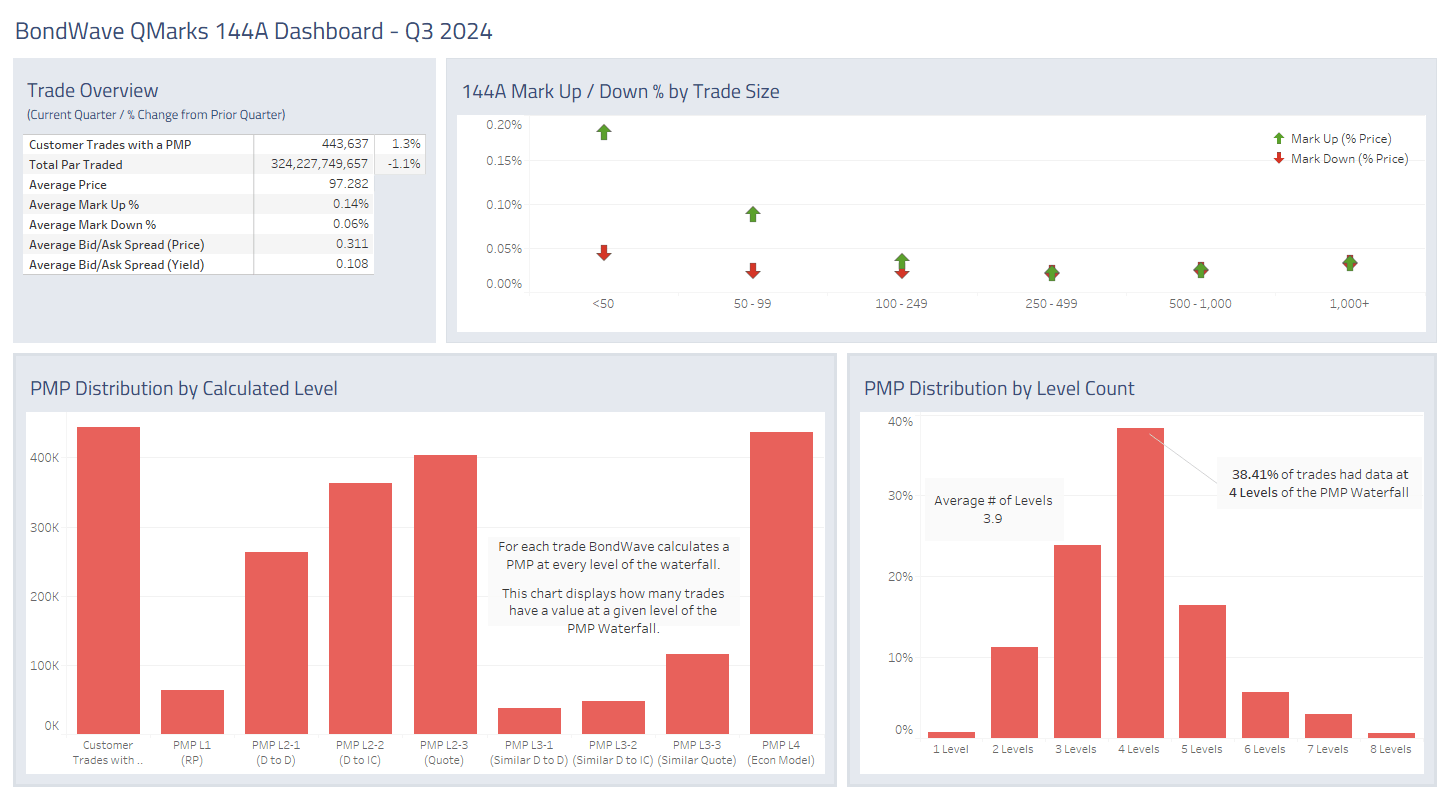
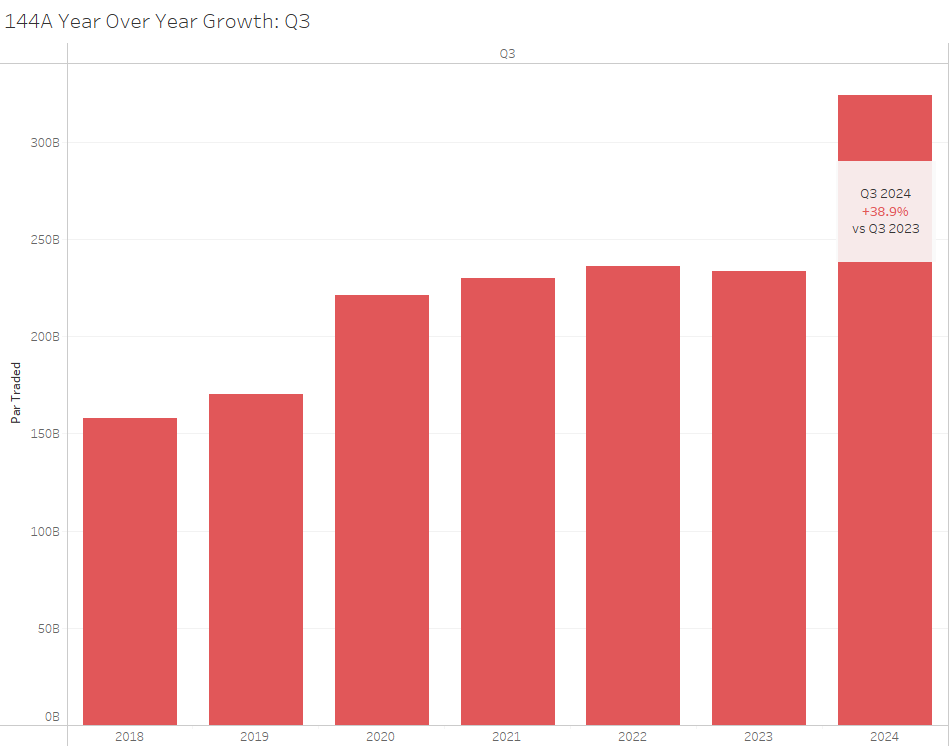
- The 144A market did not follow suit with the registered bond market as par value traded shrank 1.1% vs Q2 2024.
- However, on a year over year basis the 144A market saw impressive growth, outpacing Q3 2023 by 38.9%. This made Q3 2024 the second most active quarter ever.
- As an institutional-dominated market, mark ups and mark downs remained stable.
Source: BondWave QMarks
Municipal Bond Market Trends
Source: BondWave QMarks
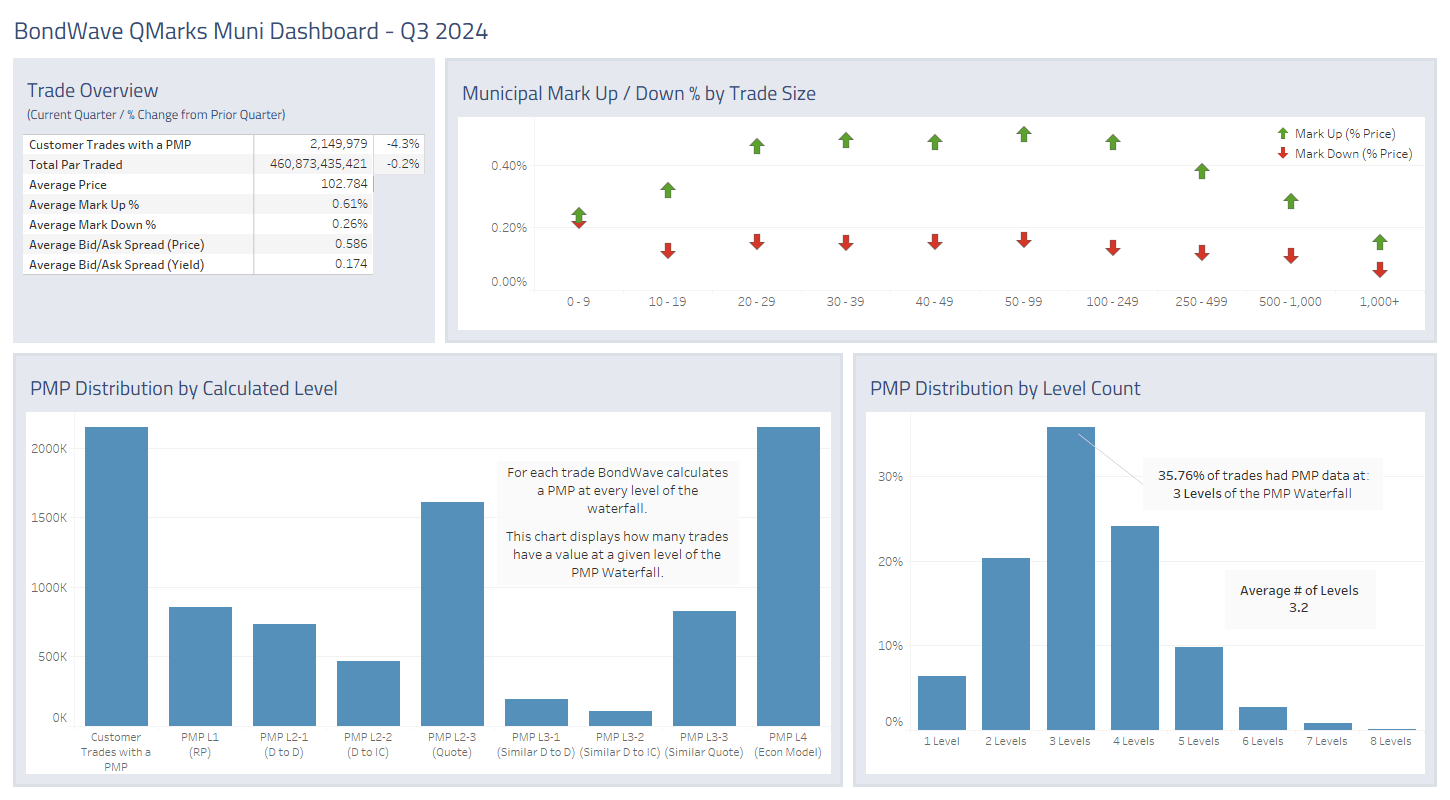
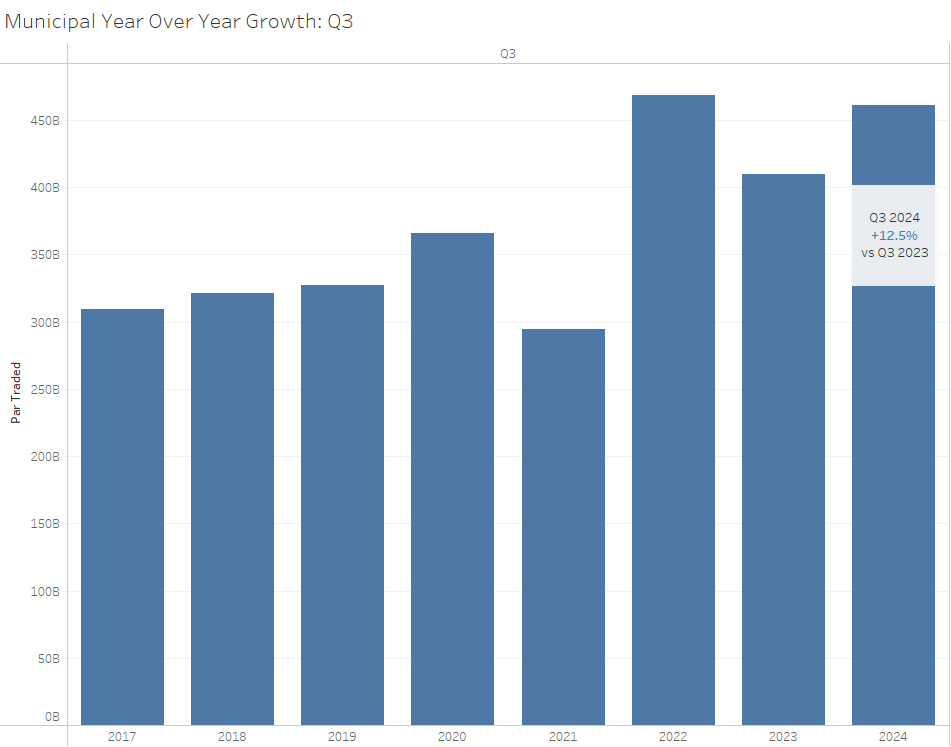
- The municipal market saw a modestly smaller par traded in Q3 2024 than in Q2 2024, down 0.2%.
- However, when seasonally adjusted, municipal par traded grew 12.5% – coming in as the third most active quarter ever, only trailing last quarter and Q2 2022.
- Year over year, municipal mark ups have decreased nearly 10% (61 bps vs 67 bps) while mark downs have decreased 7% (26 bps vs 28 bps).
Source: BondWave QMarks
Agency Bond Market Trends
Source: BondWave QMarks
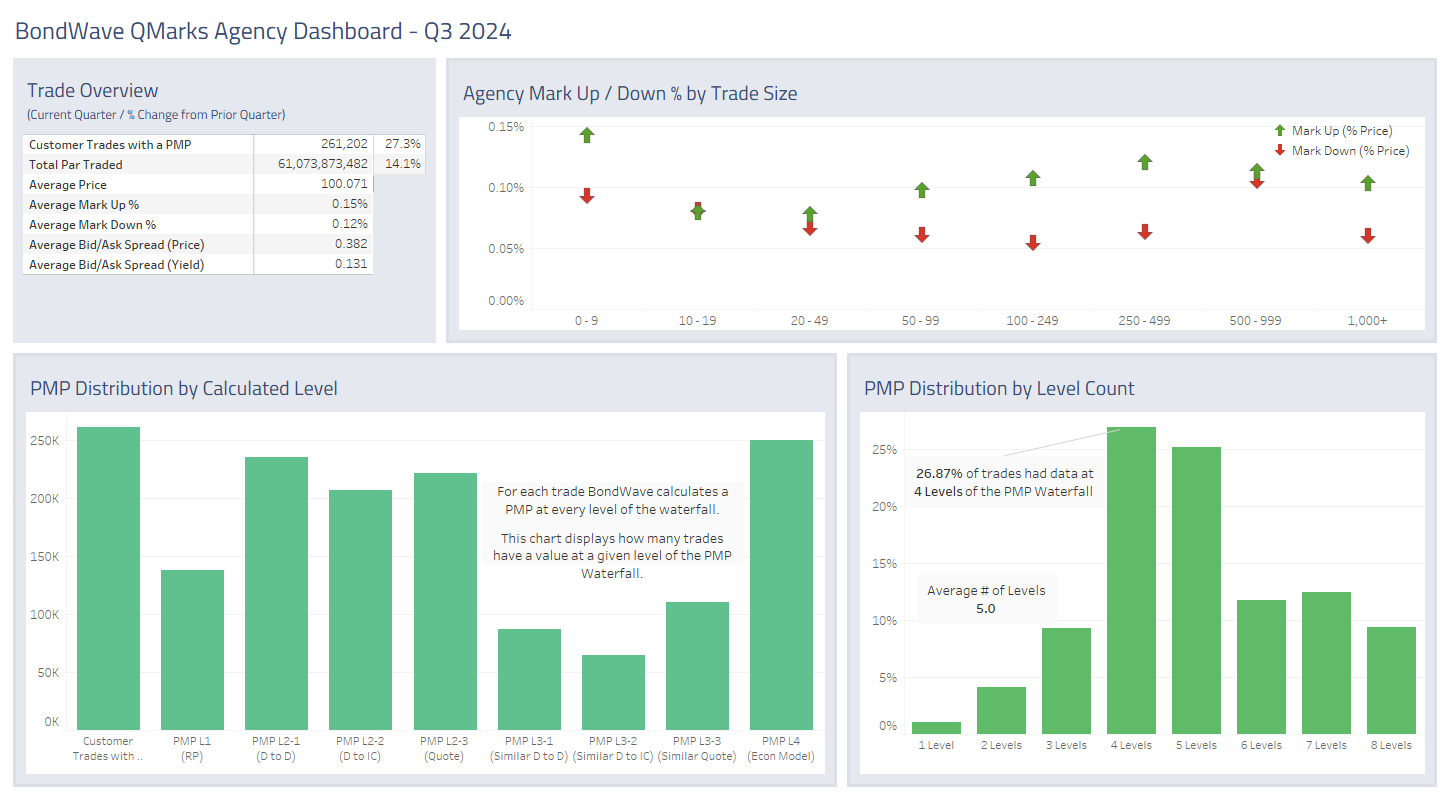
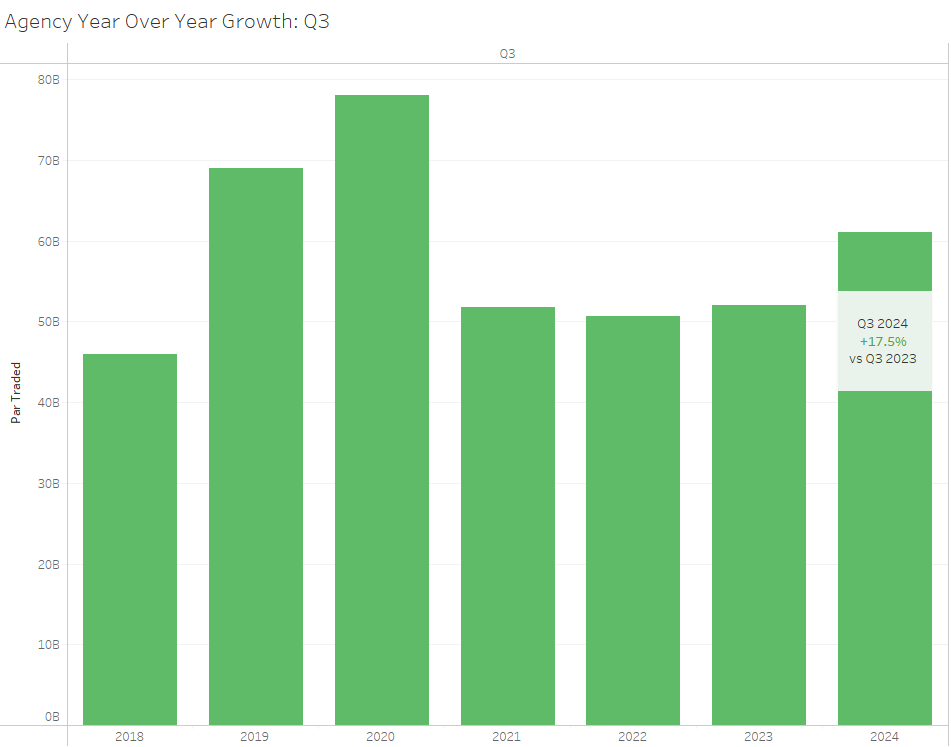
- The agency market par trade volume jumped 14%, with an even more impressive 17.5% year over year growth rate.
- Mark ups and mark downs in the agency market are unchanged, as they have been in the four years we have produced these dashboards.
Source: BondWave QMarks
Dashboards for the previous quarters referenced above are located here:
Last quarter: Q2 2024 Dashboards
Year over year: Q3 2023 Dashboards

