Developed to help bond market participants better understand trading trends in the fixed income markets, BondWave’s Data Lab has released its QMarksTM dashboards for the second quarter of 2024.
QMarks is a proprietary BondWave data set that powers its quarterly dashboards to cover all disseminated bond transactions using the regulatory-prescribed Prevailing Market Price methodology for corporate, municipal, agency, and 144A. QMarks belongs to a suite of other BondWave proprietary data sets, including QCurves, QTrades, and QScores.
Q2 2024 Observations:
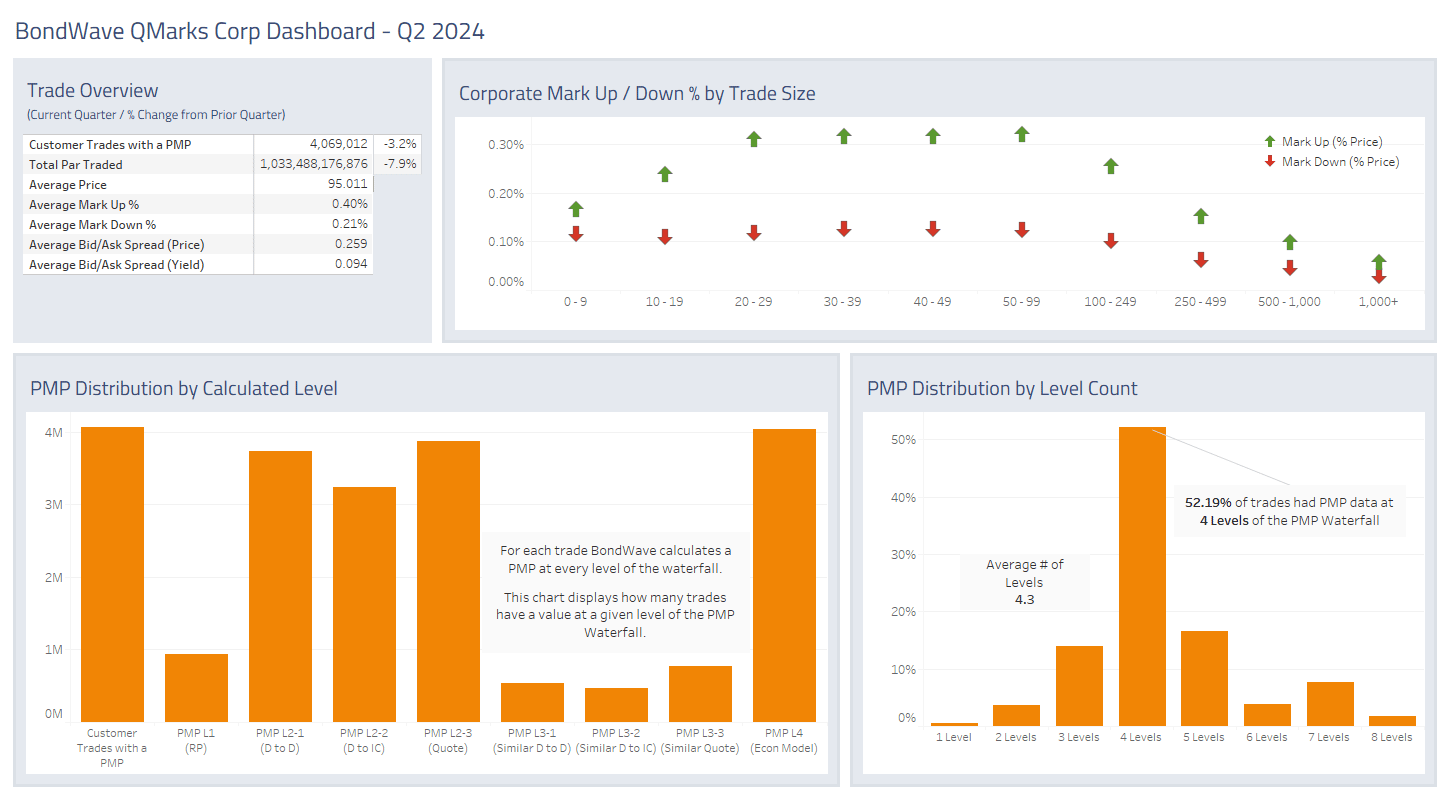
Corporate Bond Market Trends
- While corporate bond trading volume was down slightly quarter over quarter, the year over year results were more impressive.
- Total customer par traded grew 13.7% year over year, while total customer trades grew 22.5%.
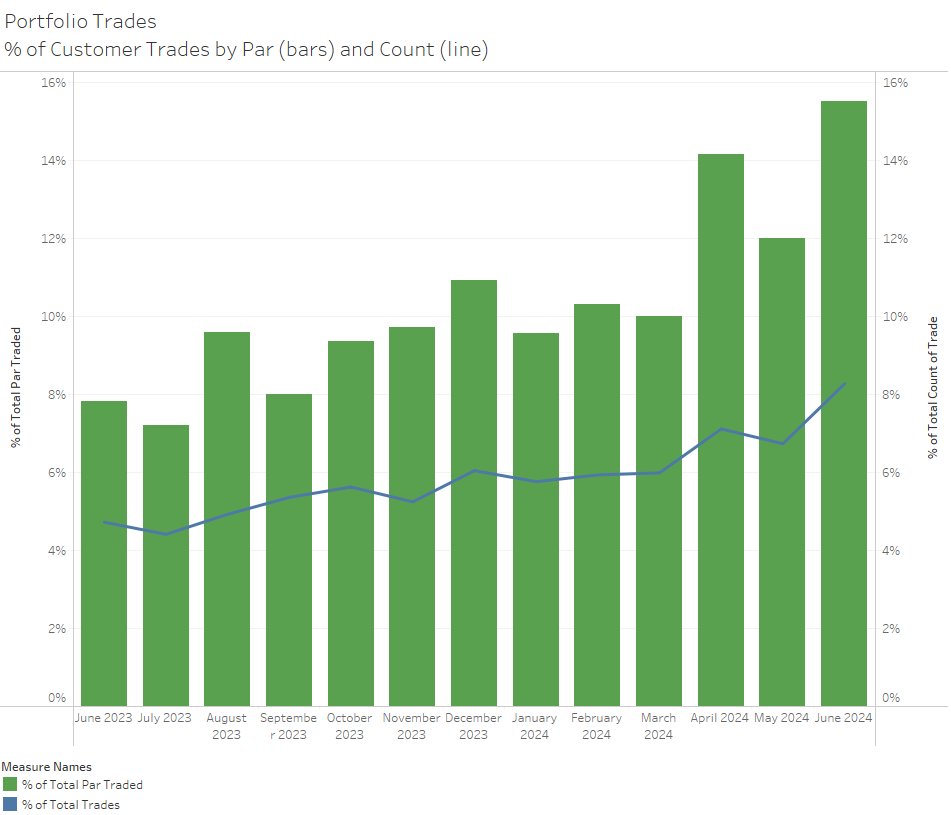
- A fair amount of the growth can be attributed to the increase in portfolio trading.
- Portfolio trading in the second quarter jumped to almost 14% of customer par traded. In June portfolio trading hit a high of 15.5% of customer par traded.
Source: BondWave QMarks
Source: BondWave QMarks
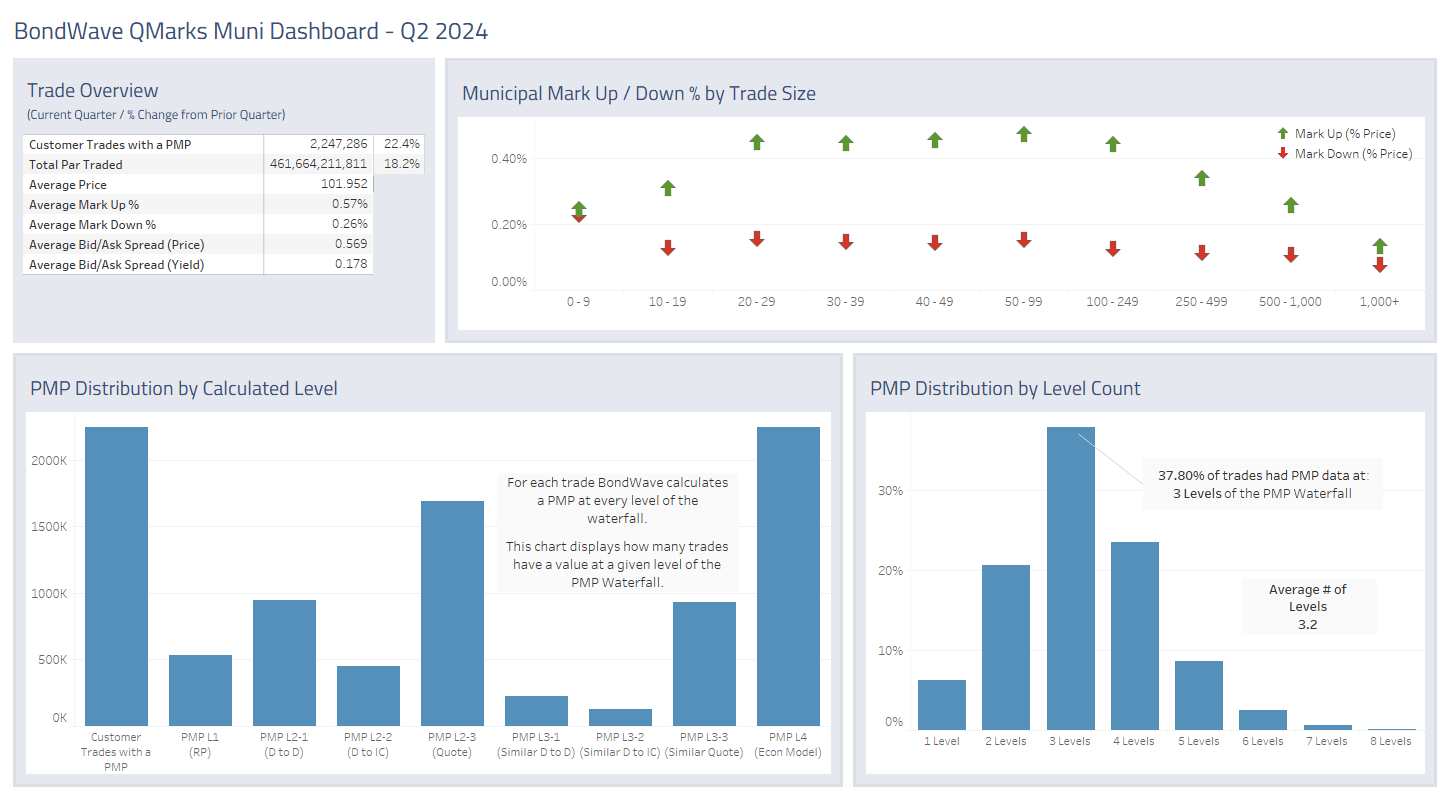
Municipal Bond Market Trends
- Municipal bond customer trading grew both quarter over quarter and year over year driven by a very strong new issue calendar.
- Relative to Q1 total customer par traded was +18.2% (total trades +22.4%) and relative to Q2 2023 customer par traded was +12.7% (total trades +35.2%).
- The increased volumes corresponded with decreased trading costs.
- Average mark-ups decreased from 0.69% in Q2 2023 to 0.57% in Q2 2024 (no attempt has been made to control for differences in bonds traded between the two time periods).
- Average mark-downs were little changed (0.27% vs. 0.26%).
Source: BondWave QMarks
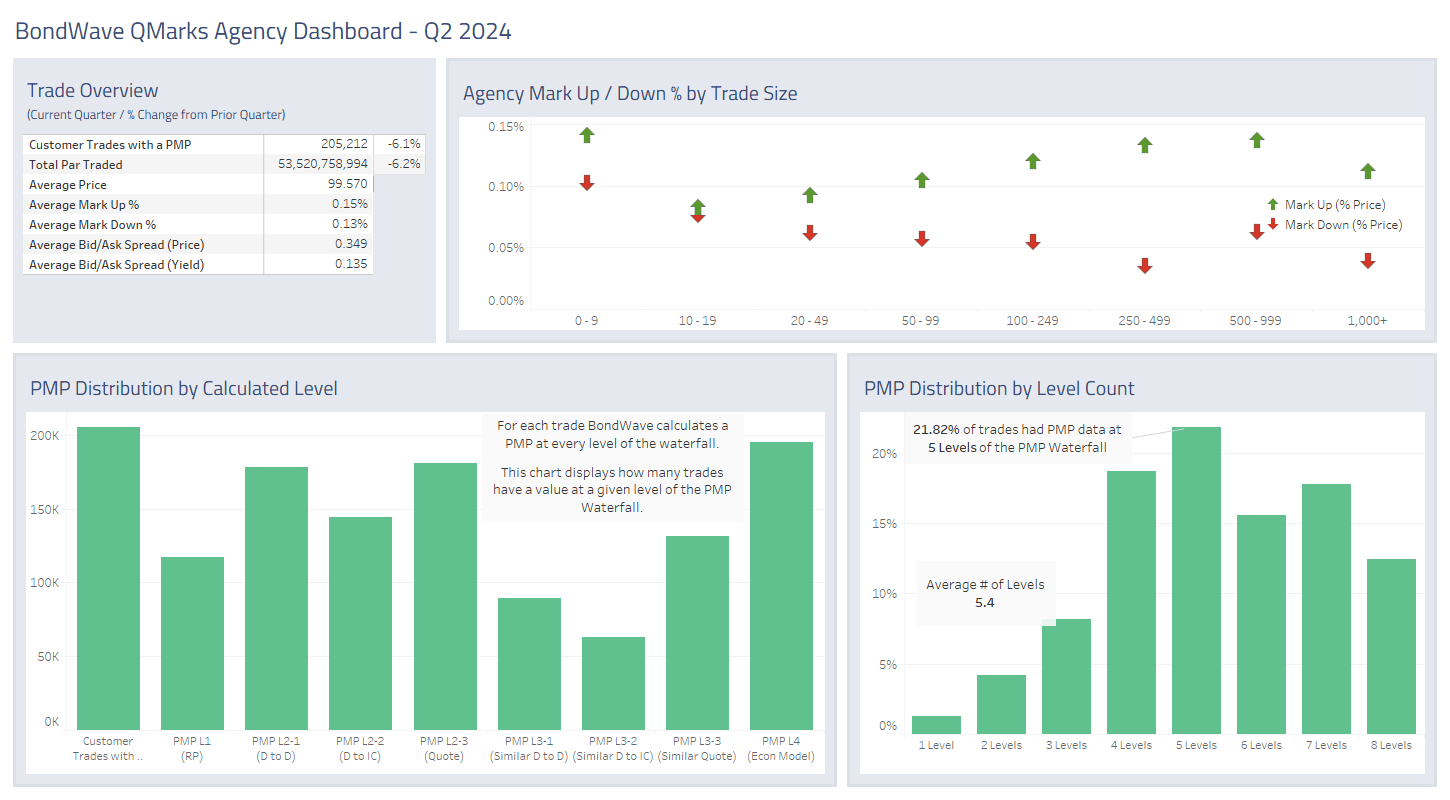
Agency Bond Market Trends
- Agency bond customer trading volumes shrank in Q2 relative to Q1 (-6.2% of par and -6.1% of trades).
- However, those same volumes represented a year over year increase (+4.3% of par and +25.7% of trades).
- Trading costs remain unchanged at 0.15% for average mark-ups and 0.13% for average mark-downs.
Source: BondWave QMarks
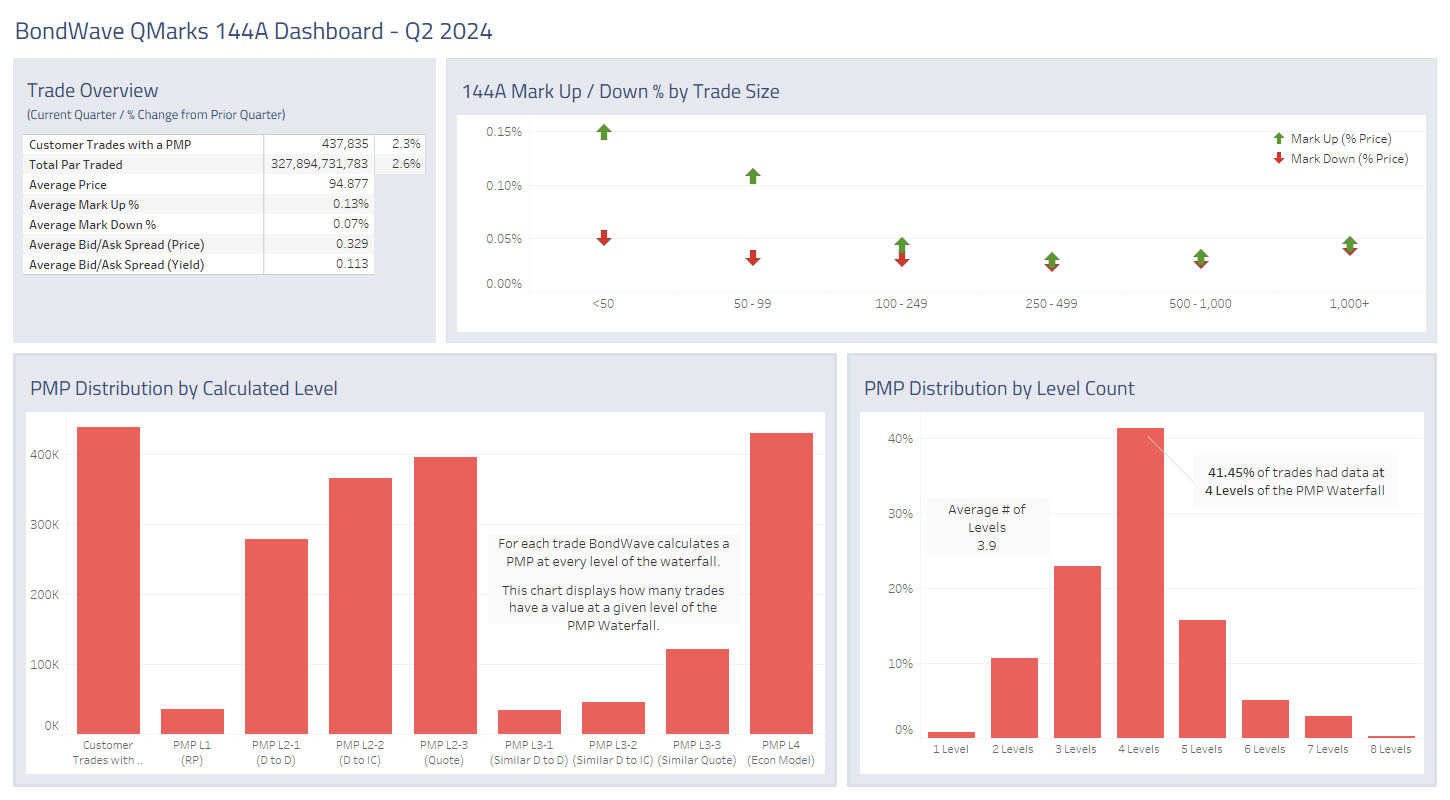
144A Bond Market Trends
- Mirroring the registered market, 144A customer volumes grew slightly quarter over quarter, but jumped in the year over year comparison.
- Total customer par traded grew 33.0% year over year. While total customer trade grew 30.8%.
Source: BondWave QMarks
Dashboards for the previous quarters referenced above are located here:
Last quarter: Q1 2024 Dashboards
Year over year: Q2 2023 Dashboards
