Developed to help bond market participants better understand trading trends in the fixed income markets, BondWave’s Data Lab has released its QMarksTM dashboards for the second quarter of 2023.
QMarks is a proprietary BondWave data set that powers its quarterly dashboards to cover all disseminated bond transactions using the regulatory-prescribed Prevailing Market Price methodology for corporate, municipal, agency, and 144A. QMarks belongs to a suite of other BondWave proprietary data sets, including QCurves, QTrades, and QScores.
Q2 2023 Observations:
Customer Trade Volume
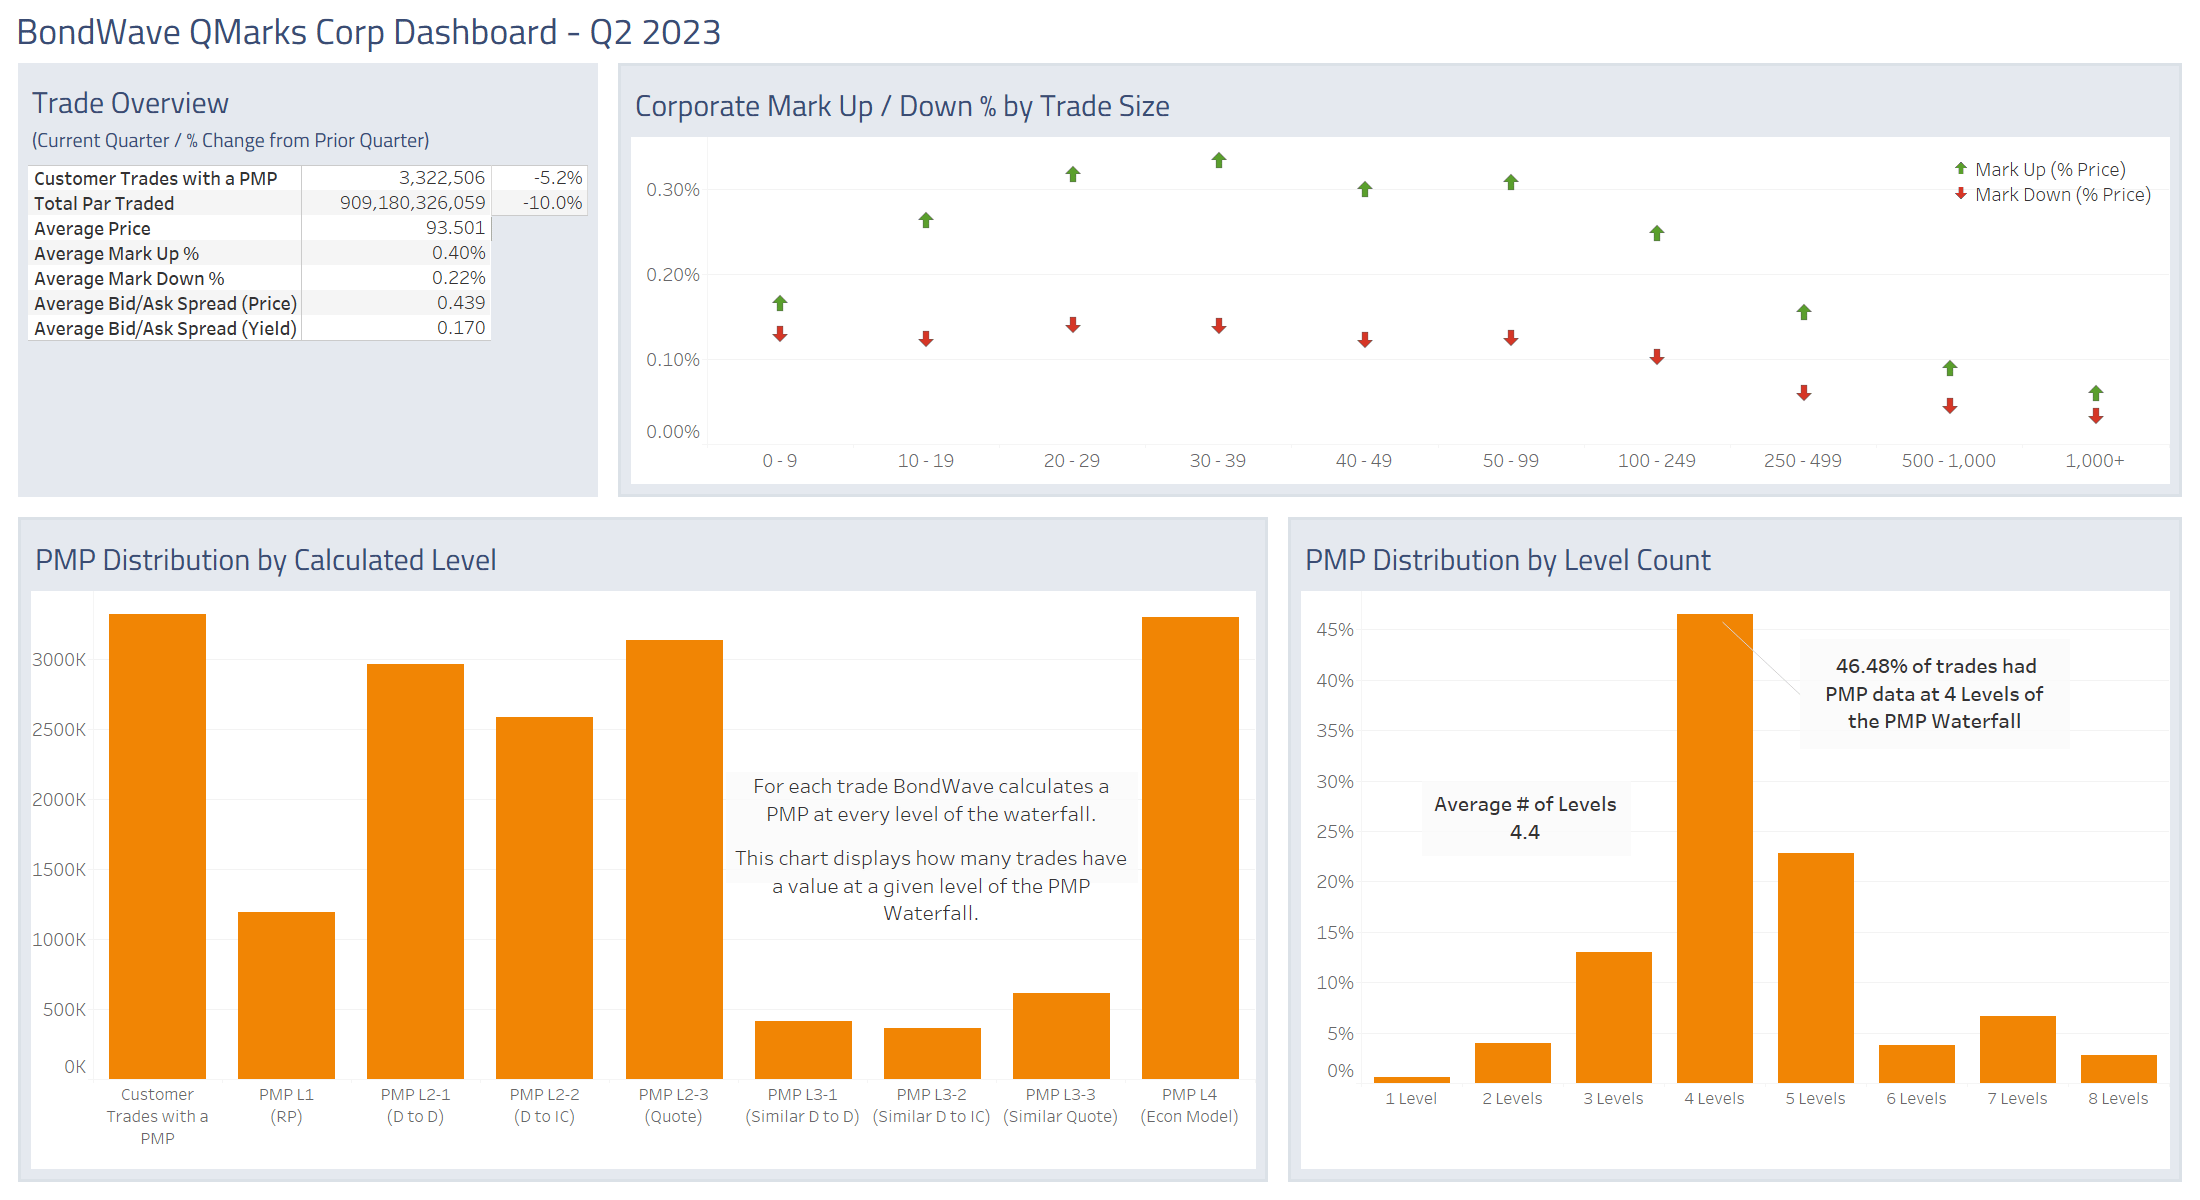
Corporate trade counts have come in slightly from their high-water mark achieved in Q1. While customer trade counts are down 5% this quarter, it represents the second highest quarterly total we have seen. These high trade counts are not backed up by equally high par values traded, showing that average trade sizes continue to shrink. In an upcoming article, BondWave will explore the relationship between portfolio trading and shrinking corporate bond trade sizes.
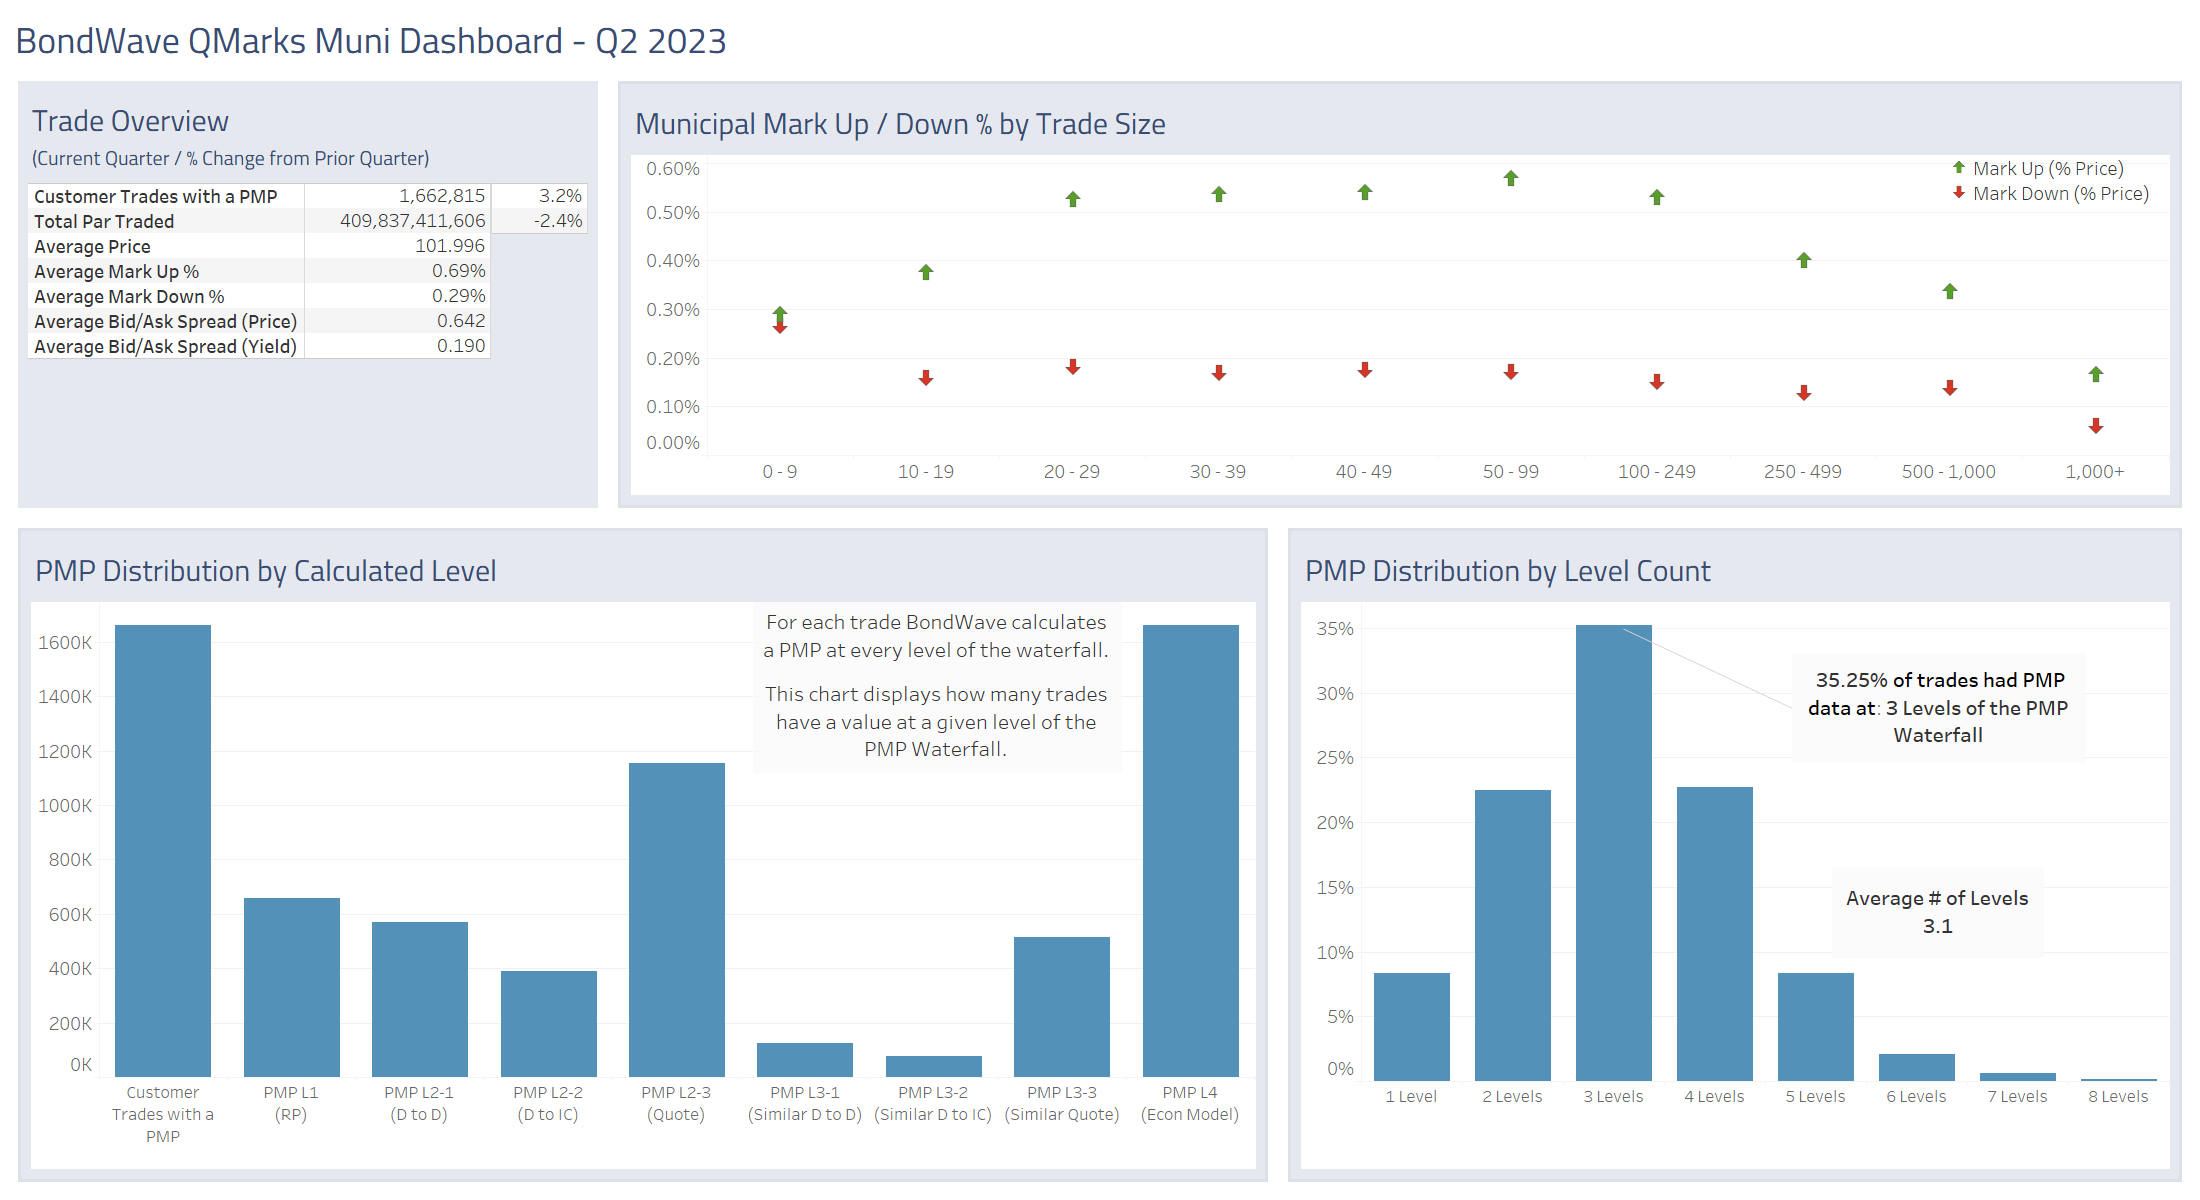
Municipal bond trade counts and par traded have returned to more normal levels as the initial wave of trading in response to interest rate increases has partially subsided.
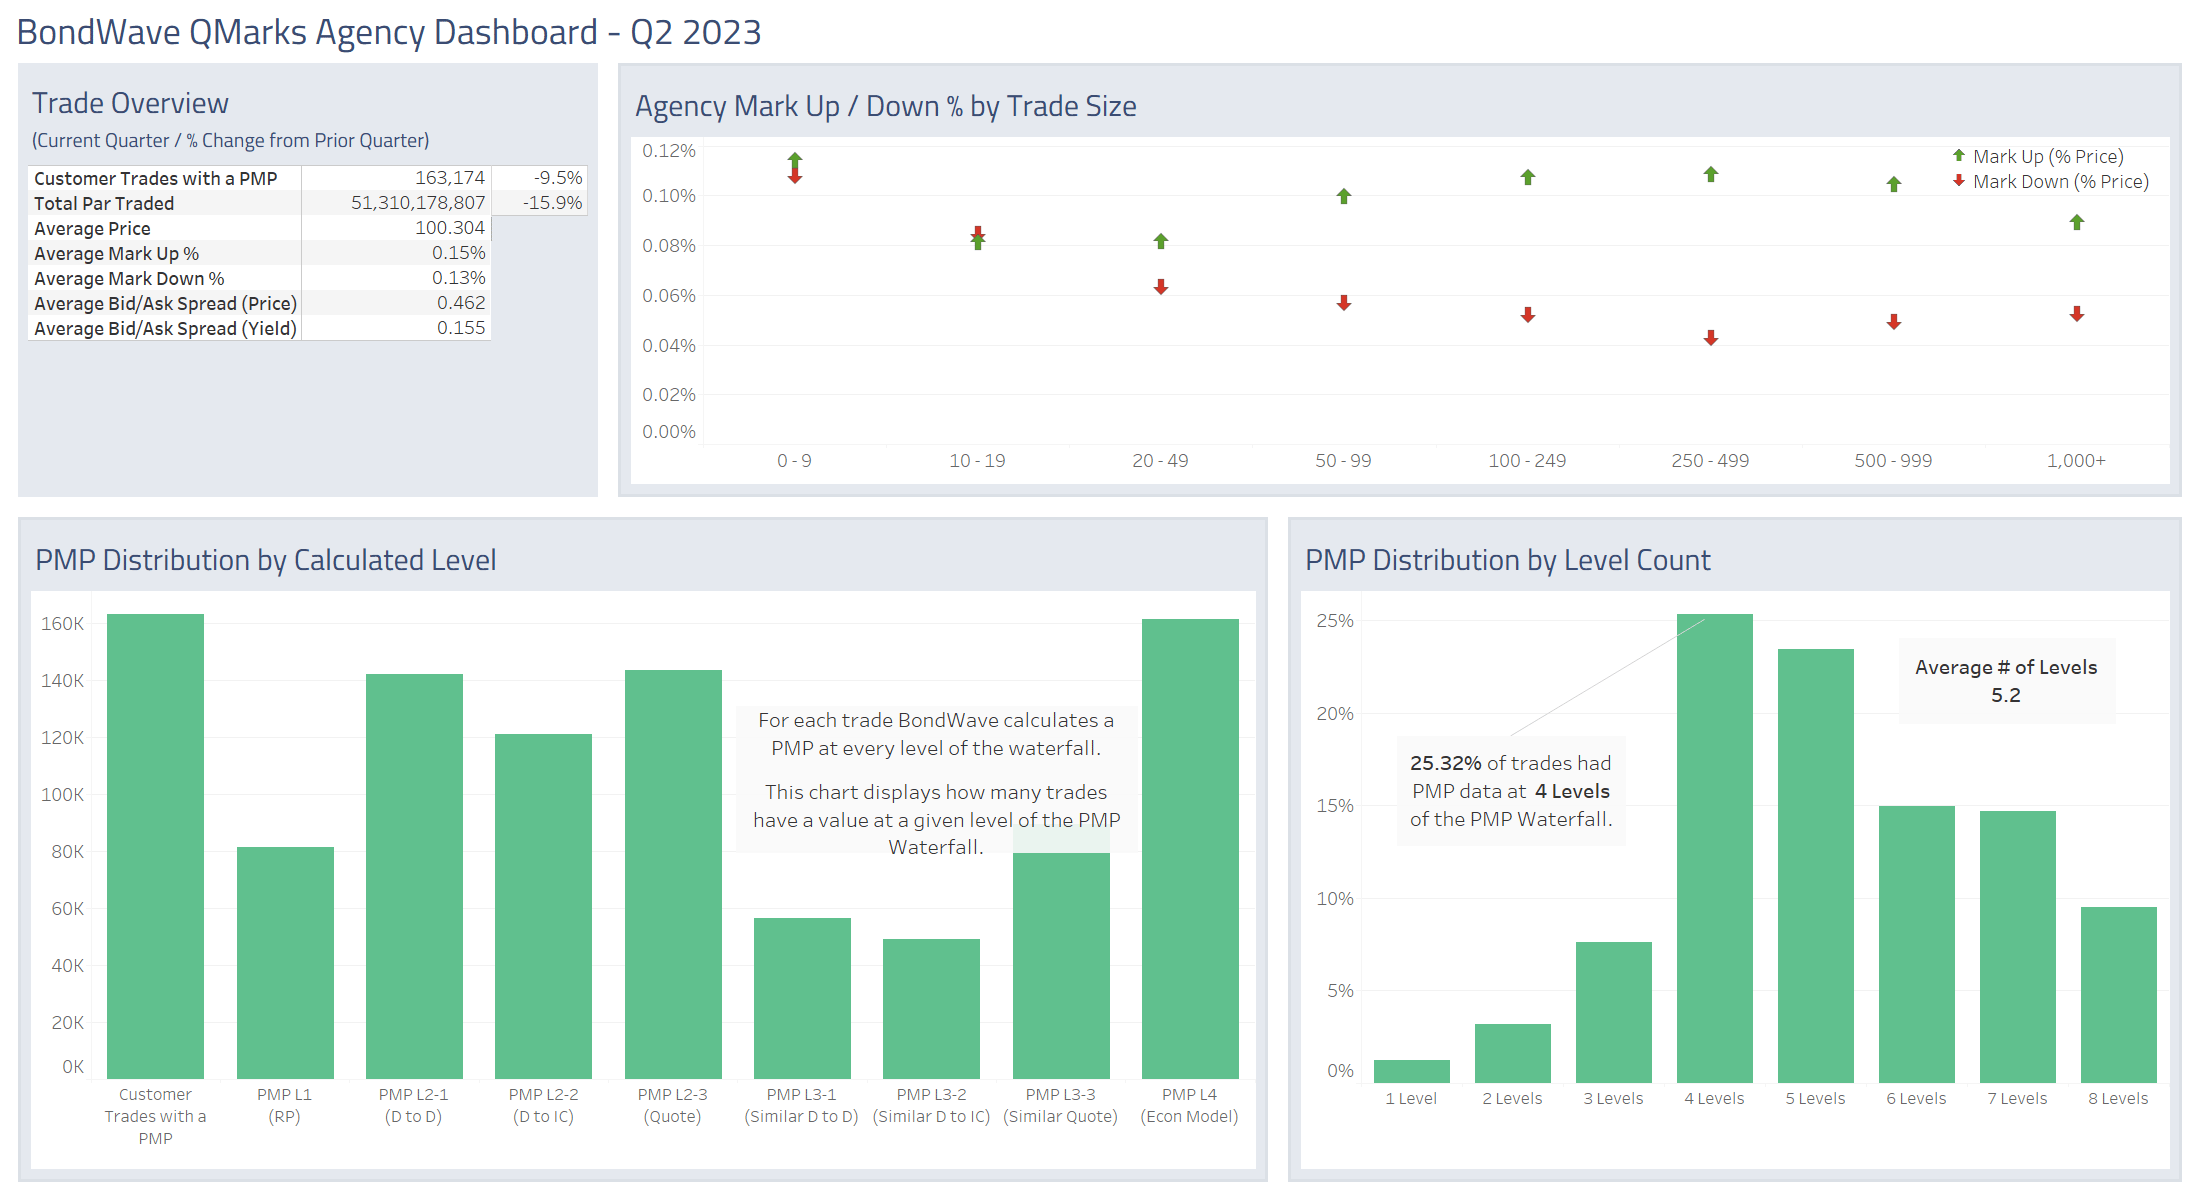
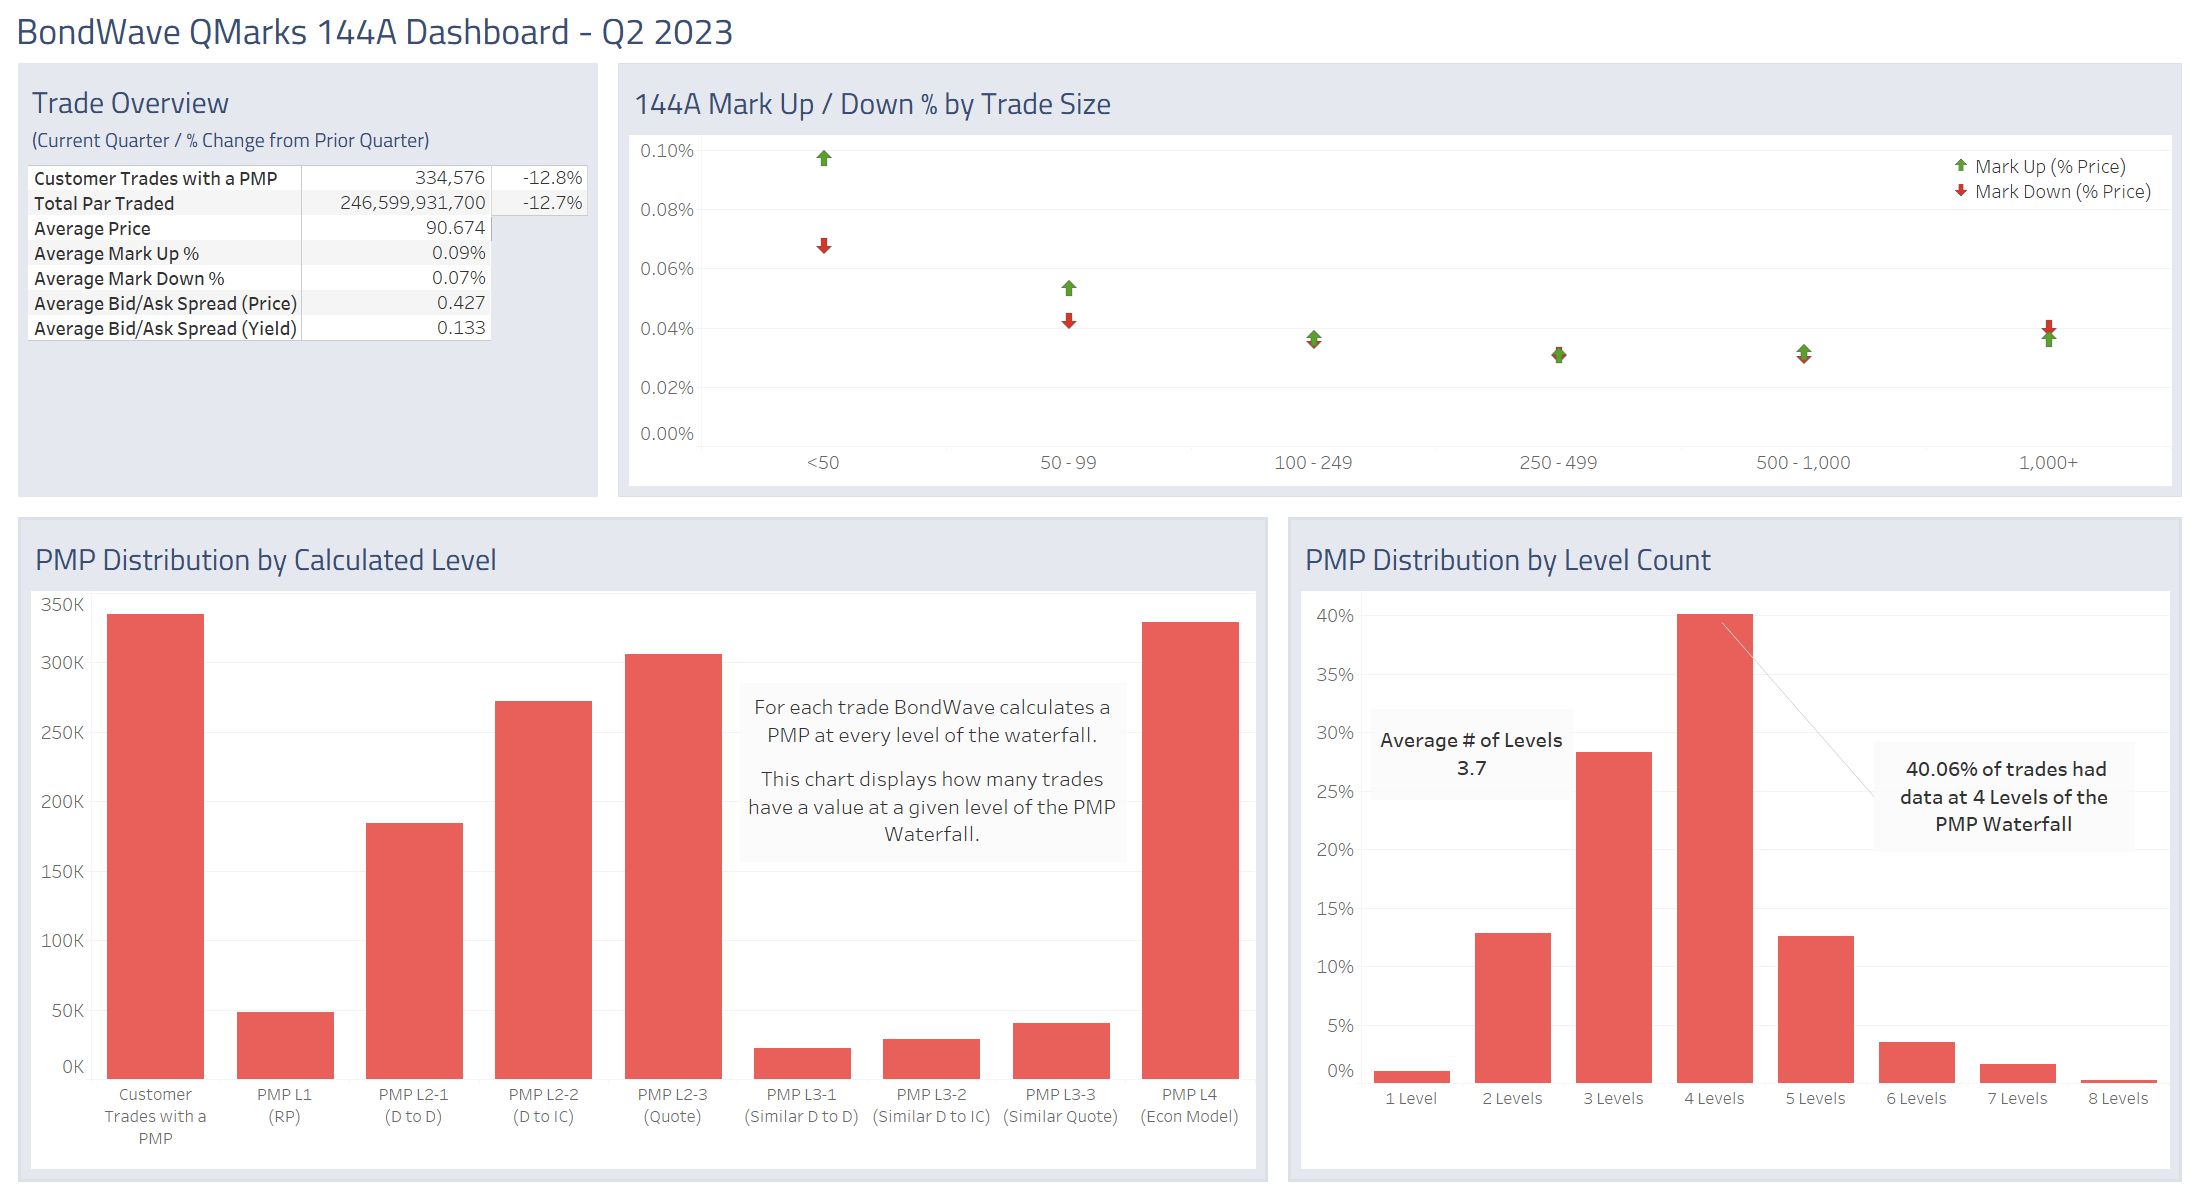
144A, corporate bonds, and agency bonds saw significant decreases in both trade counts and par traded.
Trade Costs
Corporate trade costs did grow during the quarter while they shrunk for municipal bonds. The average corporate bid/ask spread was 10% wider than in Q1 of this year, while the average municipal bid/ask spread was 13% narrower. Agency bond bid/ask spreads widened significantly (35%), while 144A bond bid/ask spreads were unchanged.
Corporate Bond Market Trends

Source: BondWave QMarks
Municipal Bond Market Trends

Source: BondWave QMarks
Agency Bond Market Trends

Source: BondWave QMarks
144A Bond Market Trends

Source: BondWave QMarks
Dashboards for the previous quarter referenced above are located here: Q1 2023 Dashboards

