Developed to help bond market participants better understand trading trends in the fixed income markets, BondWave’s Data Lab has released its QMarksTM dashboards for the second quarter of 2022.
Formerly known as Universal Prevailing Market Price (UPMP), QMarks is a proprietary BondWave data set that powers its quarterly dashboards to cover all disseminated bond transactions using the regulatory-prescribed Prevailing Market Price methodology for corporate, municipal, agency, and 144A. QMarks belongs to a suite of other BondWave proprietary data sets, including QCurves, QTrades, and QScores.
Q2 2022 Observations: Soaring Trade Volumes Did Not Improve Liquidity in Q2
“With multiple Fed Funds rate hikes during the quarter in response to inflation, trading volumes soared in corporate and municipal bonds in the second quarter. However, the extra volume did not mean more liquidity, as trading costs also jumped. Municipal bonds provide the extreme example. Volumes doubled from the prior year, but the cost to trade as measured by the bid/ask spread increased nearly 15% year-over-year.” – Paul Daley, Managing Director
Corporate Bond Market Trends
Observations:
- Corporate volumes as measured by the number of trades jumped 23% from Q1 2022 to Q2 2022, and 33.6% year-over-year.
- However, trades sizes shrunk significantly as total par traded was up only 1.5%, and 5.7% year-over-year.
- For the first time since we began publishing dashboards (Q4 2020), the average corporate trade price was below par. At 95.563 the average price is 5.4% lower than Q1, and 9.9% lower than a year ago.
- At the same time, the average bid/ask spread of traded corporate bonds has grown to 43 basis points in Q2 2022, up 21.8% for the quarter and 8% year-over-year.
- No attempt has been made to normalize the price and bid/ask spread data for changes in the types of bonds traded from quarter-to-quarter.
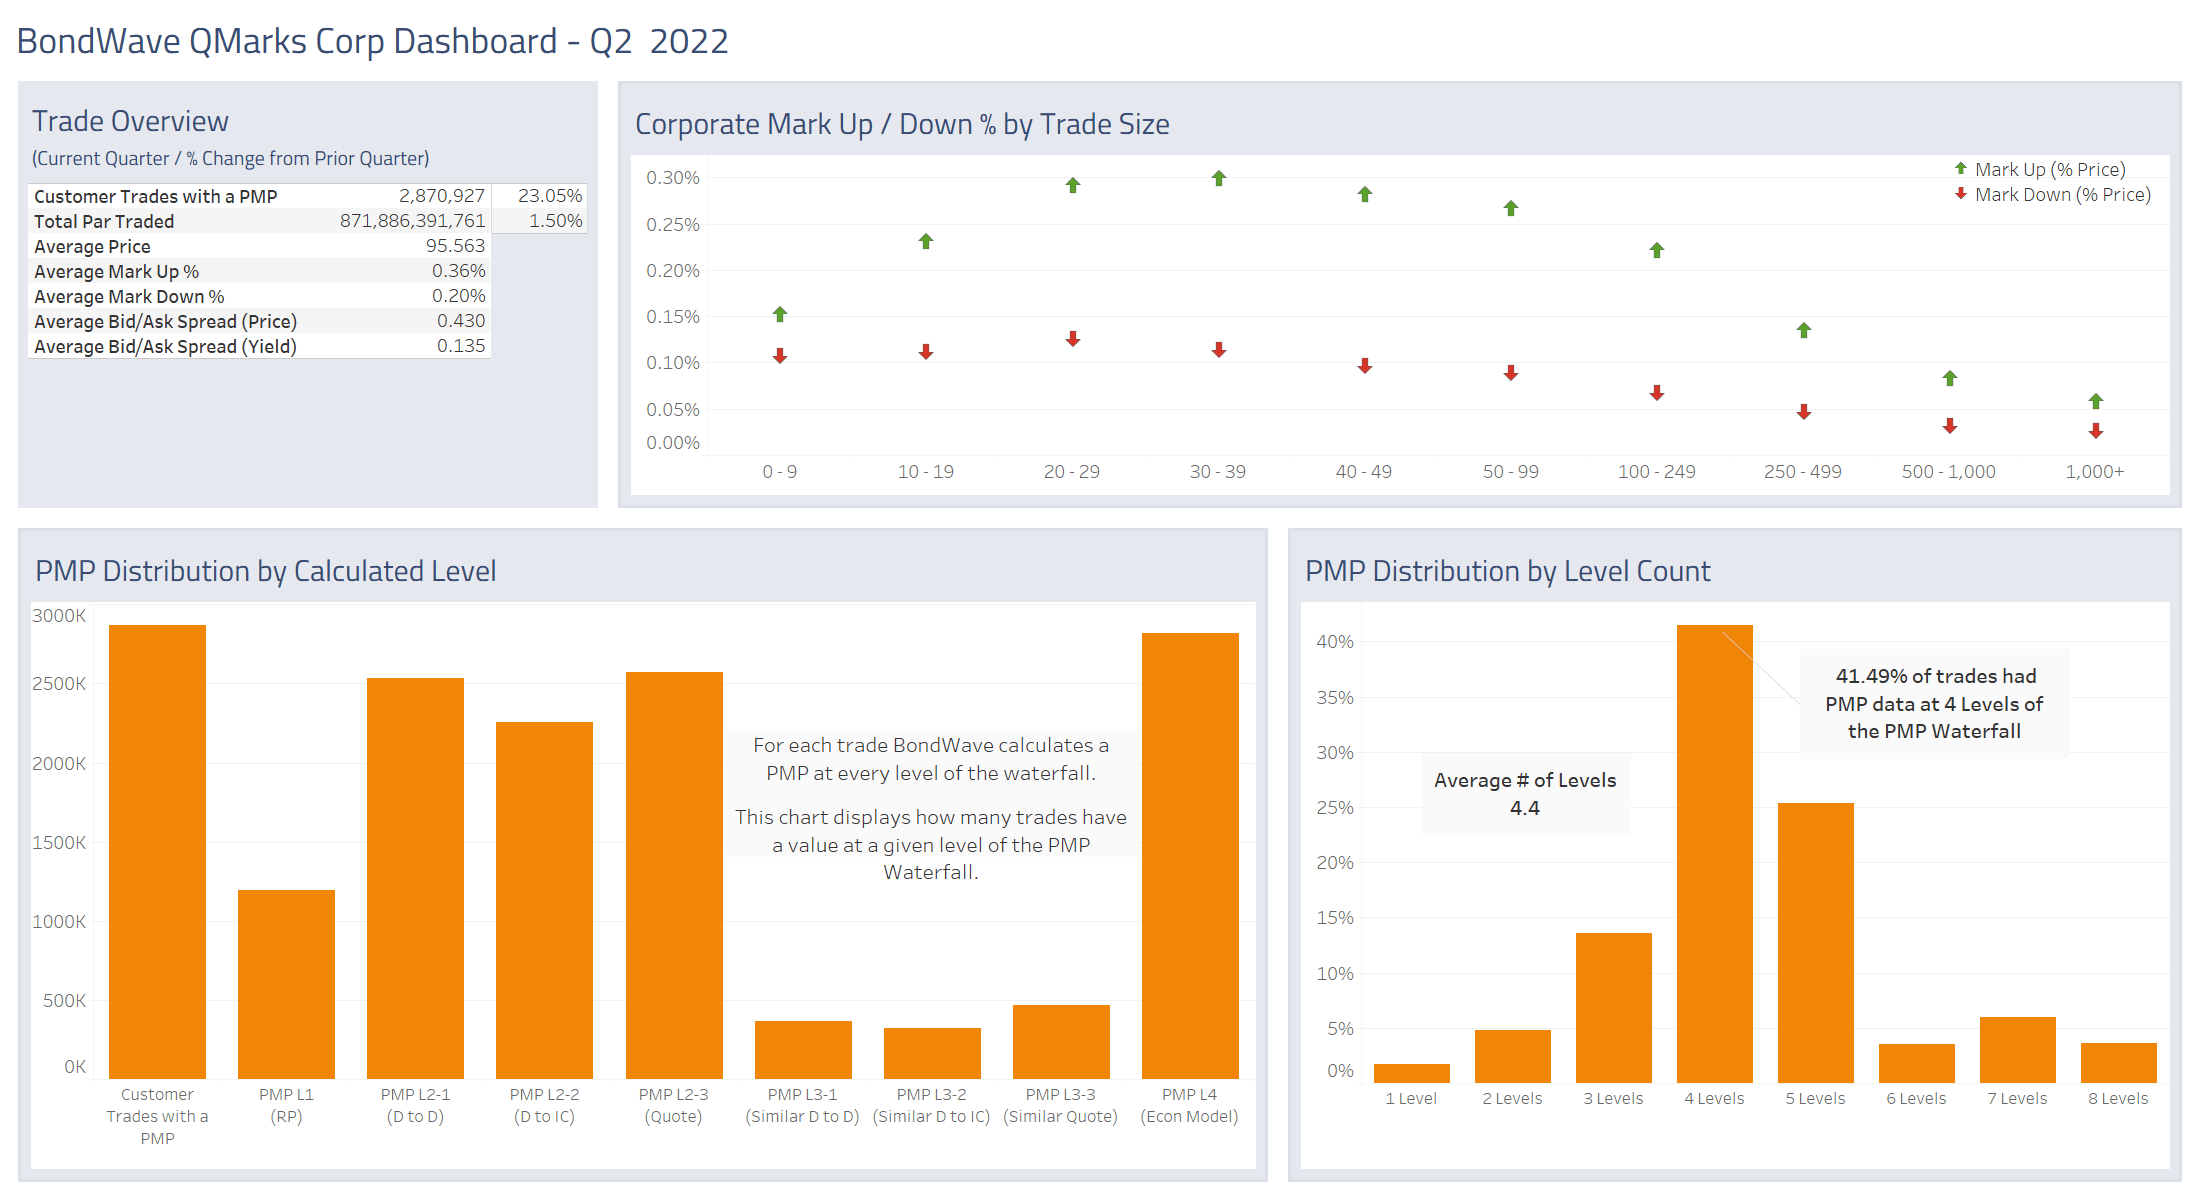
Source: BondWave QMarks
Municipal Bond Market Trends
Observations:
- Municipal volumes as measured by the number of trades jumped 35.3% from Q1 2022 to Q2 2022, and 72% year-over-year.
- Total par traded also jumped. From Q1 2022 to Q2 2022, par traded was up 30.8%. And Q2 2022 par traded was double Q2 2021.
- As rates moved higher in the second quarter the average price of a traded municipal bond came in significantly lower, from over 108 in Q1 to 103.310 in Q2.
- At the same time, the average bid/ask spread of traded municipal bonds has grown to 68 basis points in Q2 2022, up 22.3% for the quarter and 14.8% year-over-year.
- No attempt has been made to normalize the price and bid/ask spread data for changes in the types of bonds traded from quarter-to-quarter.
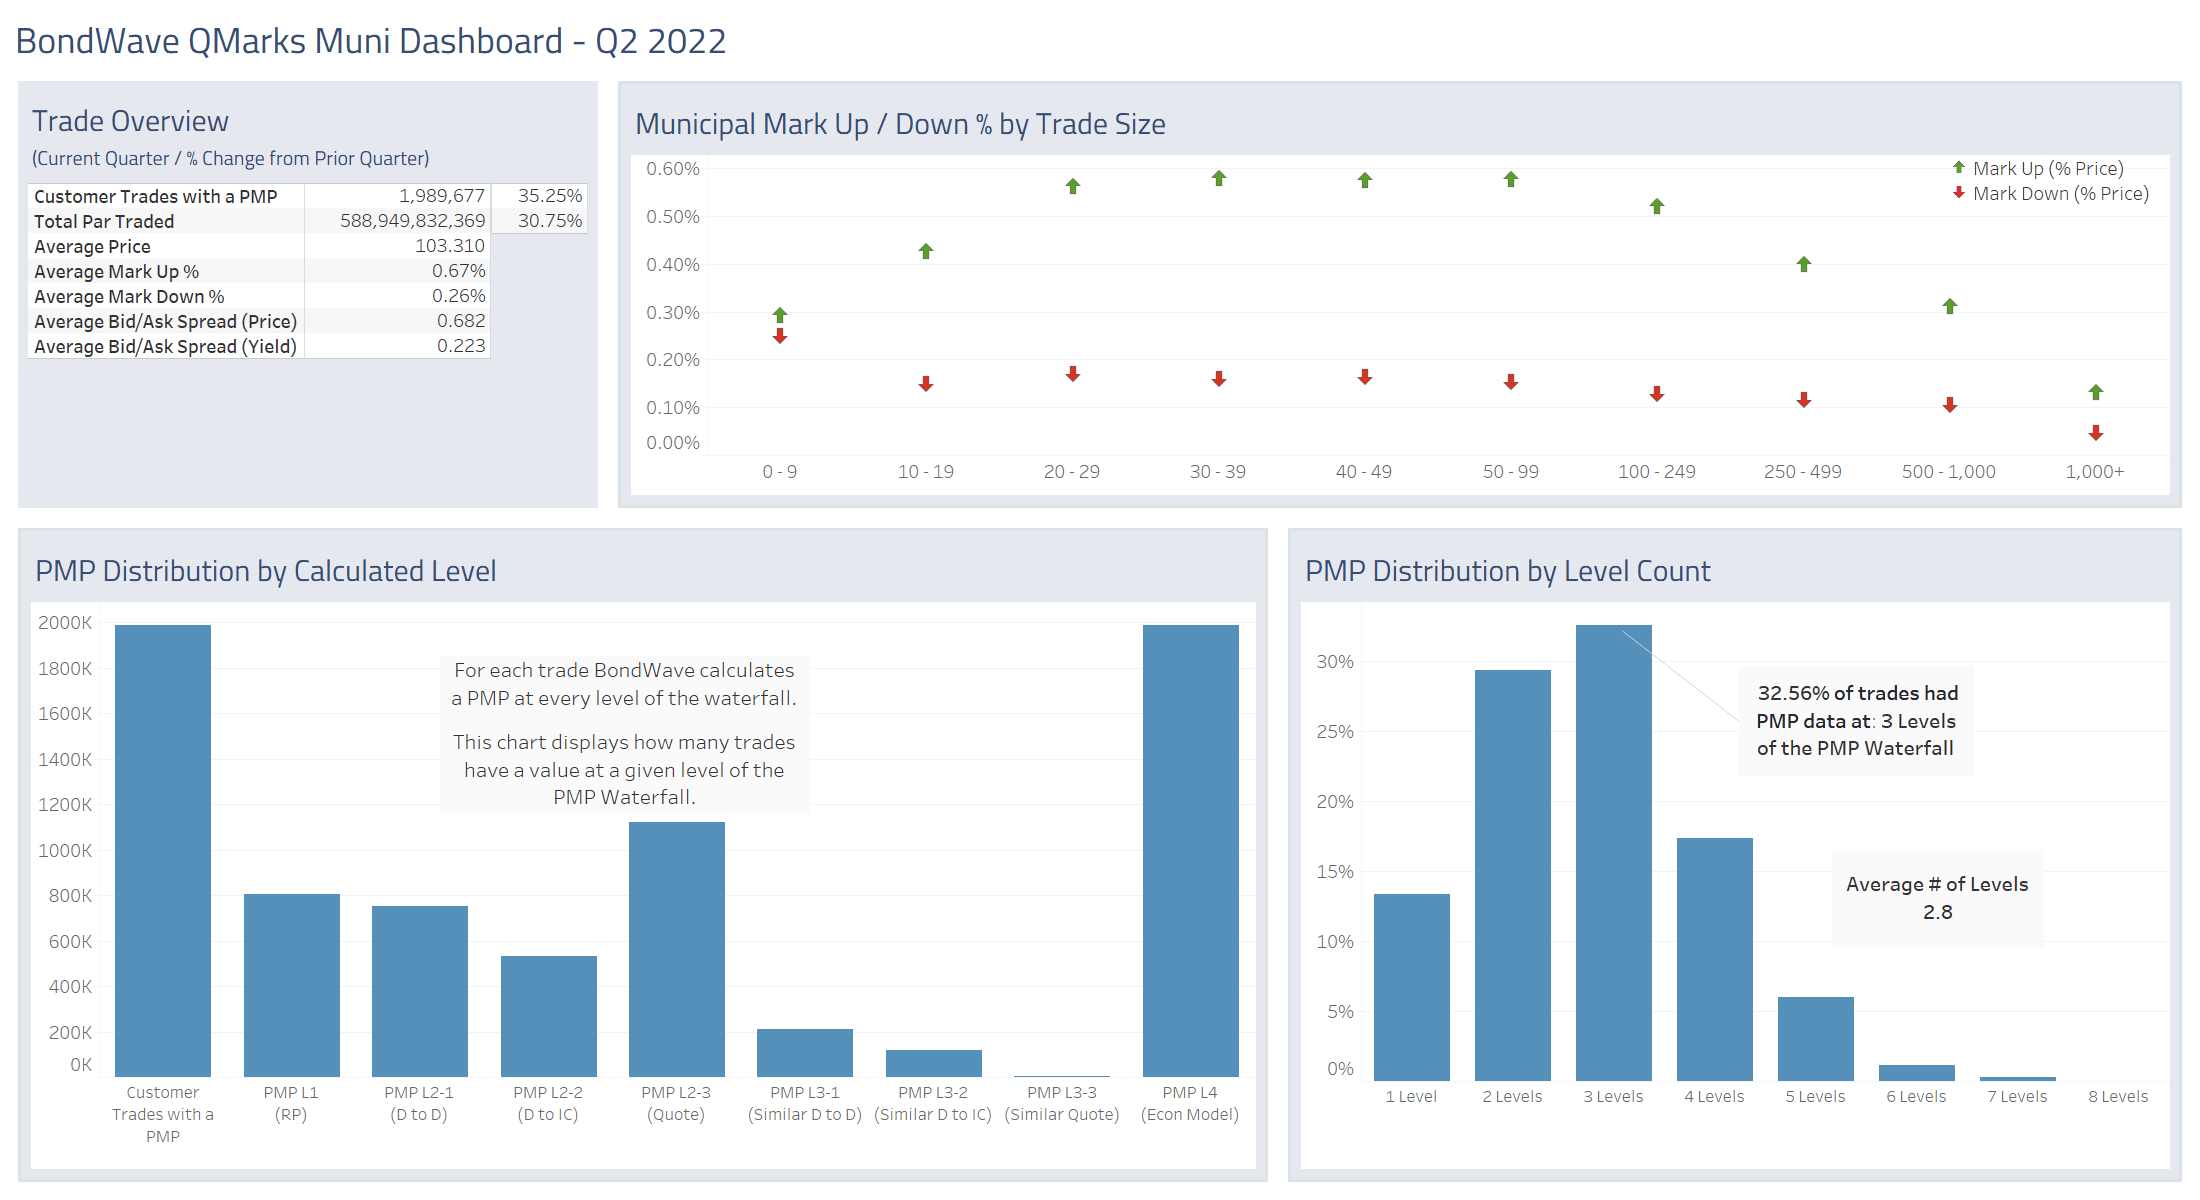
Source: BondWave QMarks
Agency Bond Market Trends
Observations:
- Agency volumes as measured by the number of trades jumped 42.2% from Q1 2022 to Q2 2022, and 39.7% year-over-year.
- However, trades sizes shrunk very significantly as total par traded was actually down 12.2% for the quarter and down 24.2% year-over-year.
- The average agency trade price was down somewhat. At 101.270 the average price is 1.2% lower than Q1, and 3.3% lower than a year ago.
- While the average bid/ask spread of traded agency bonds remained steady for the quarter at 27.4 basis points, it is 29.9% wider than it was a year ago.
- No attempt has been made to normalize the price and bid/ask spread data for changes in the types of bonds traded from quarter-to-quarter.
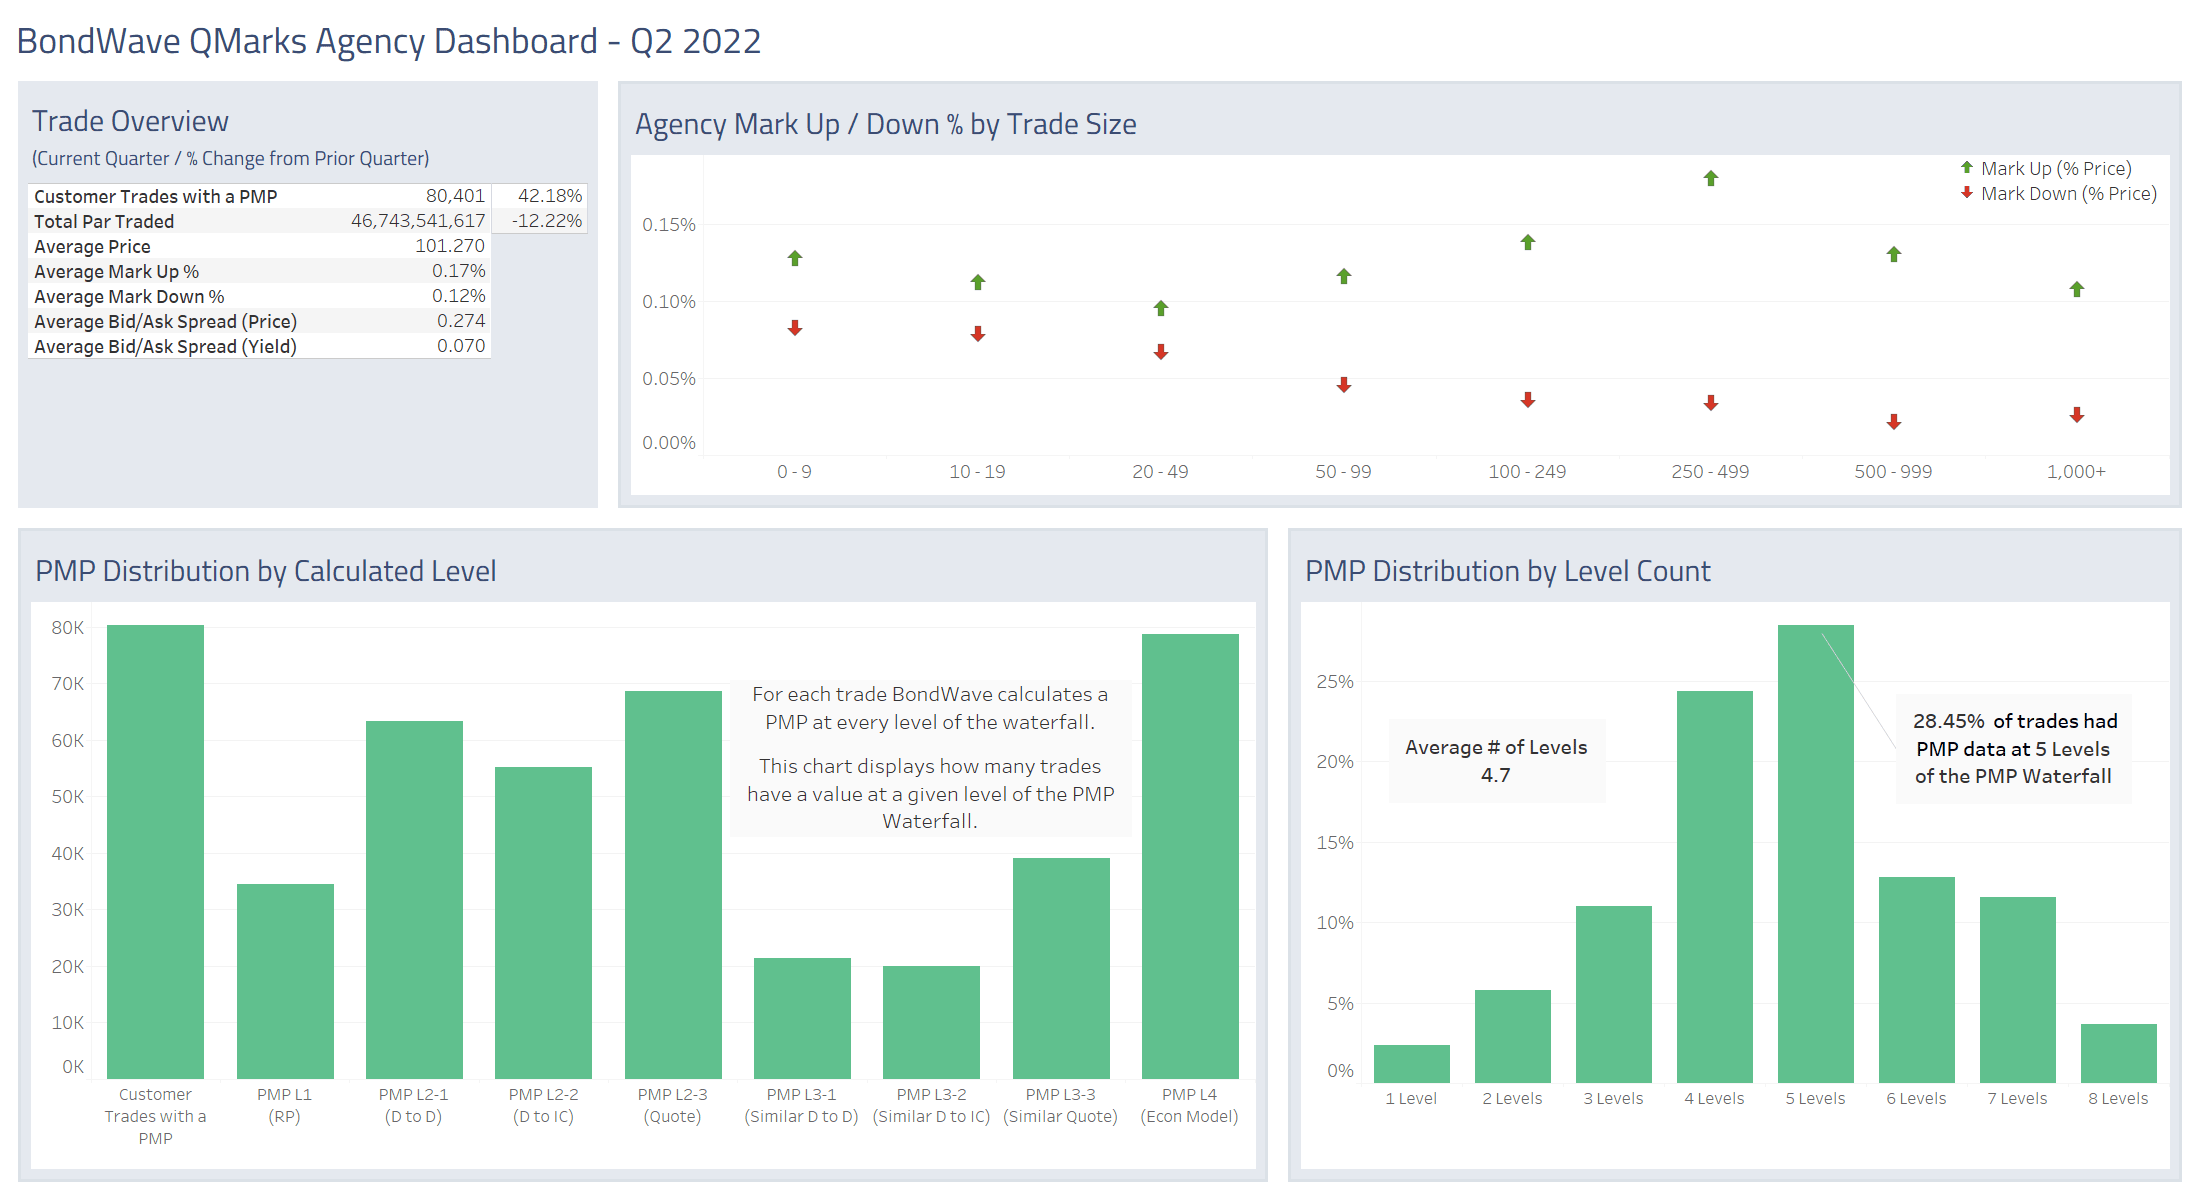
Source: BondWave QMarks
144A Bond Market Trends
Observations:
- 144A volumes as measured by the number of trades were up a relatively modest 3.9% from Q1 2022 to Q2 2022, and 16.1% year-over-year.
- However, trades sizes were mixed as total par traded was actually down 3.1% for the quarter but up 0.7% year-over-year.
- The average 144A trade price was down very significantly. At 91.058 the average price is 6.8% lower than Q1, and 12.2% lower than a year ago.
- The average bid/ask spread for traded 144A bonds also reacted strongly to recent yield increases. At 43.5 basis points the bid/ask spread is 32.6% wider than it was a quarter ago, but only 17.2% wider than it was a year ago.
- No attempt has been made to normalize the price and bid/ask spread data for changes in the types of bonds traded from quarter-to-quarter.
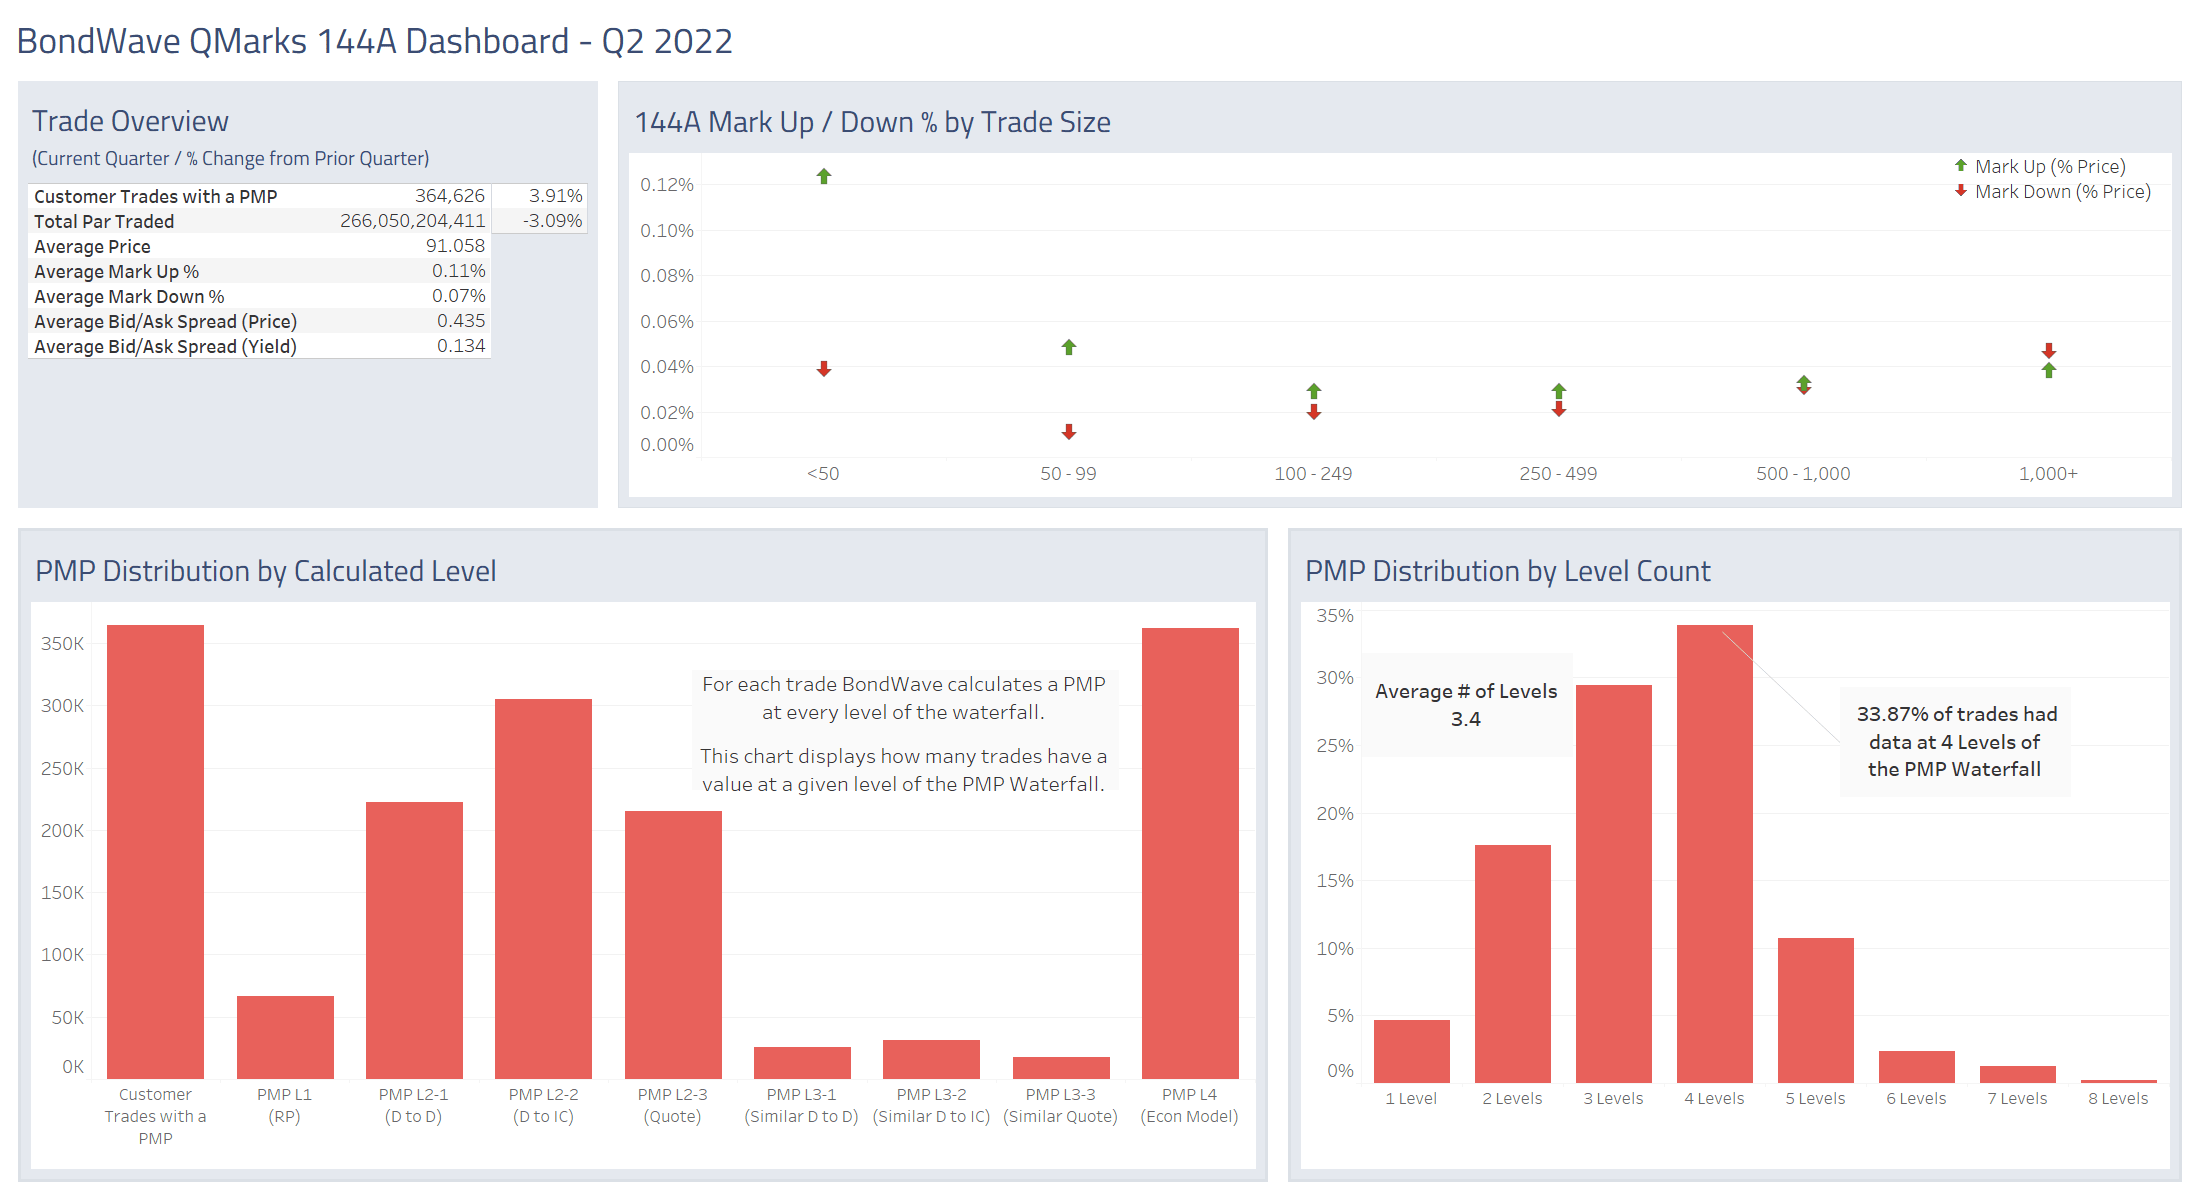
Source: BondWave QMarks
