BondWave, a leading financial technology firm servicing the fixed income market, has calculated up to eight pricing benchmarks for every customer trade disseminated by FINRA and the MSRB for asset classes requiring mark-up disclosure dating back to 2018. This Universal PMP data set is part of BondWave’s Benchmark Data & Trading Indices (BDTI), now known as QMarksTM.
Starting with Q4 2020, BondWave began producing dashboards for each of the four covered asset classes (corporate, municipal, agency, and 144A bonds) with plans to expand coverage to securitized products (MBS, ABS, CMO, etc.). The dashboards will help market participants better understand trading trends in the fixed income markets.
The following dashboards were revised in May 2021. See It’s a Trap for more details.
Fourth Quarter 2020 UPMP Dashboards
Corporate
- Corporate bond customer trading exceeded $800 billion in the fourth quarter
- Average mark-ups in the fourth quarter were 42 basis points
- Average mark-downs were 29 basis points
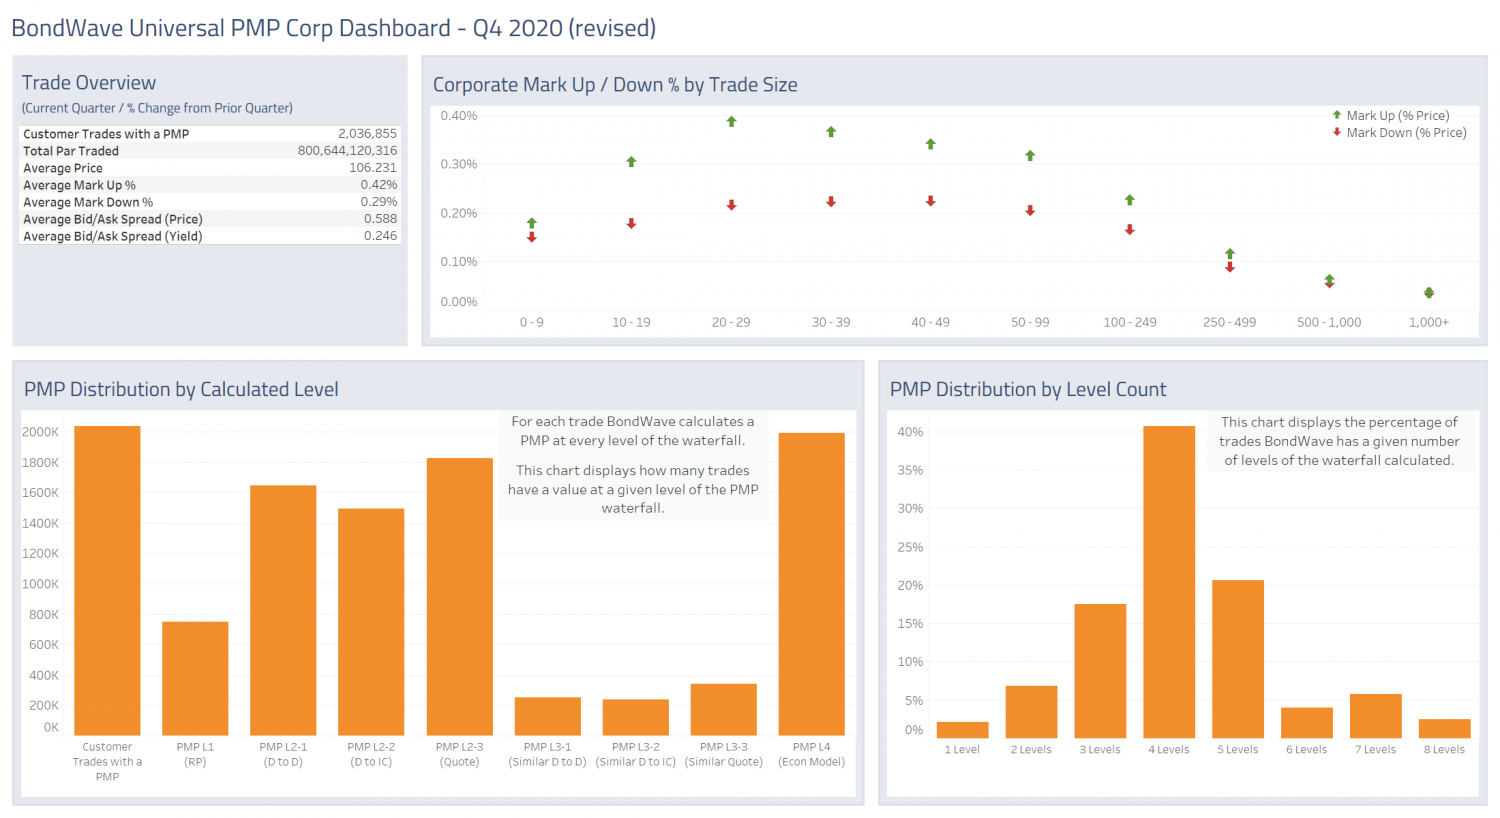
Source: BondWave BDTI
Municipal
- Municipal bond customer trading was nearly $303 billion in the fourth quarter
- Average mark-ups in the fourth quarter were 66 basis points
- Average mark-downs in the fourth quarter were 38 basis points
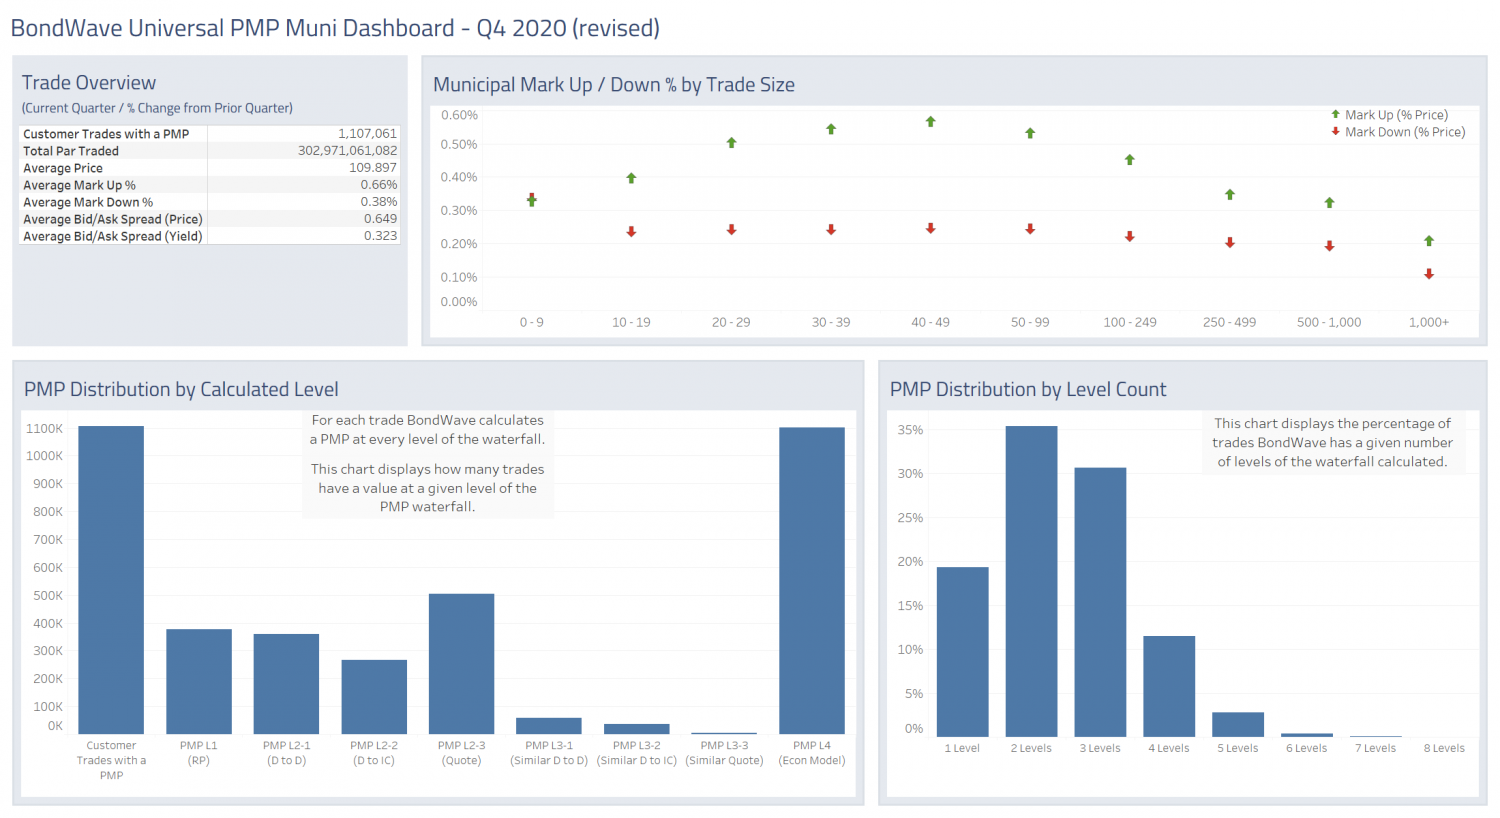
Source: BondWave BDTI
Agency
- Agency bond customer trading exceeded $65 billion in the fourth quarter
- Average mark-ups in the fourth quarter were 13 basis points
- Average mark-downs were also 17 basis points
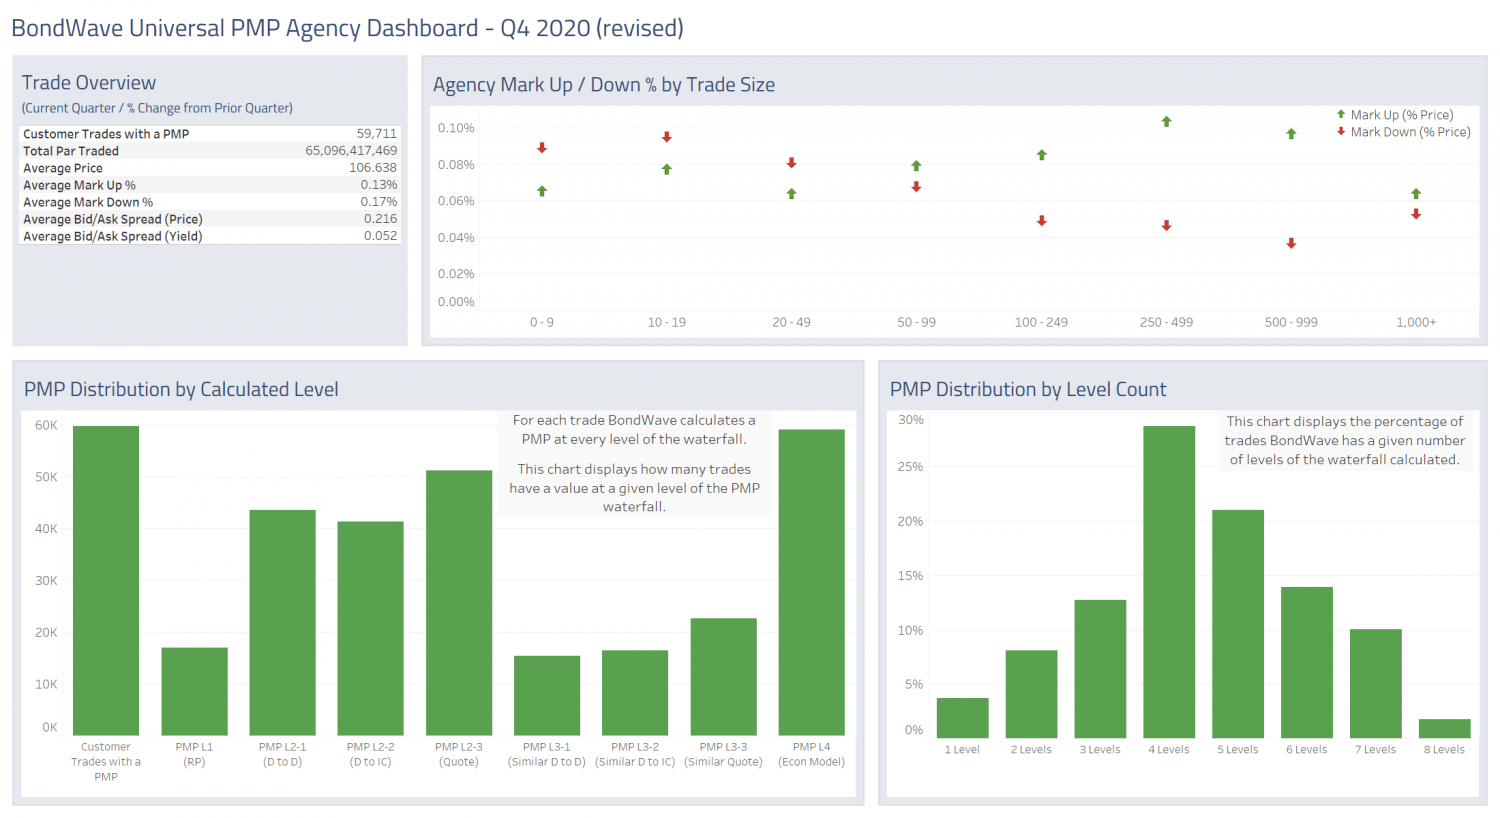
Source: BondWave BDTI
144A
- 144A bond customer trading was nearly $233 billion in the fourth quarter
- Average mark-ups in the fourth quarter were 13 basis points
- Average mark-downs were 8 basis points
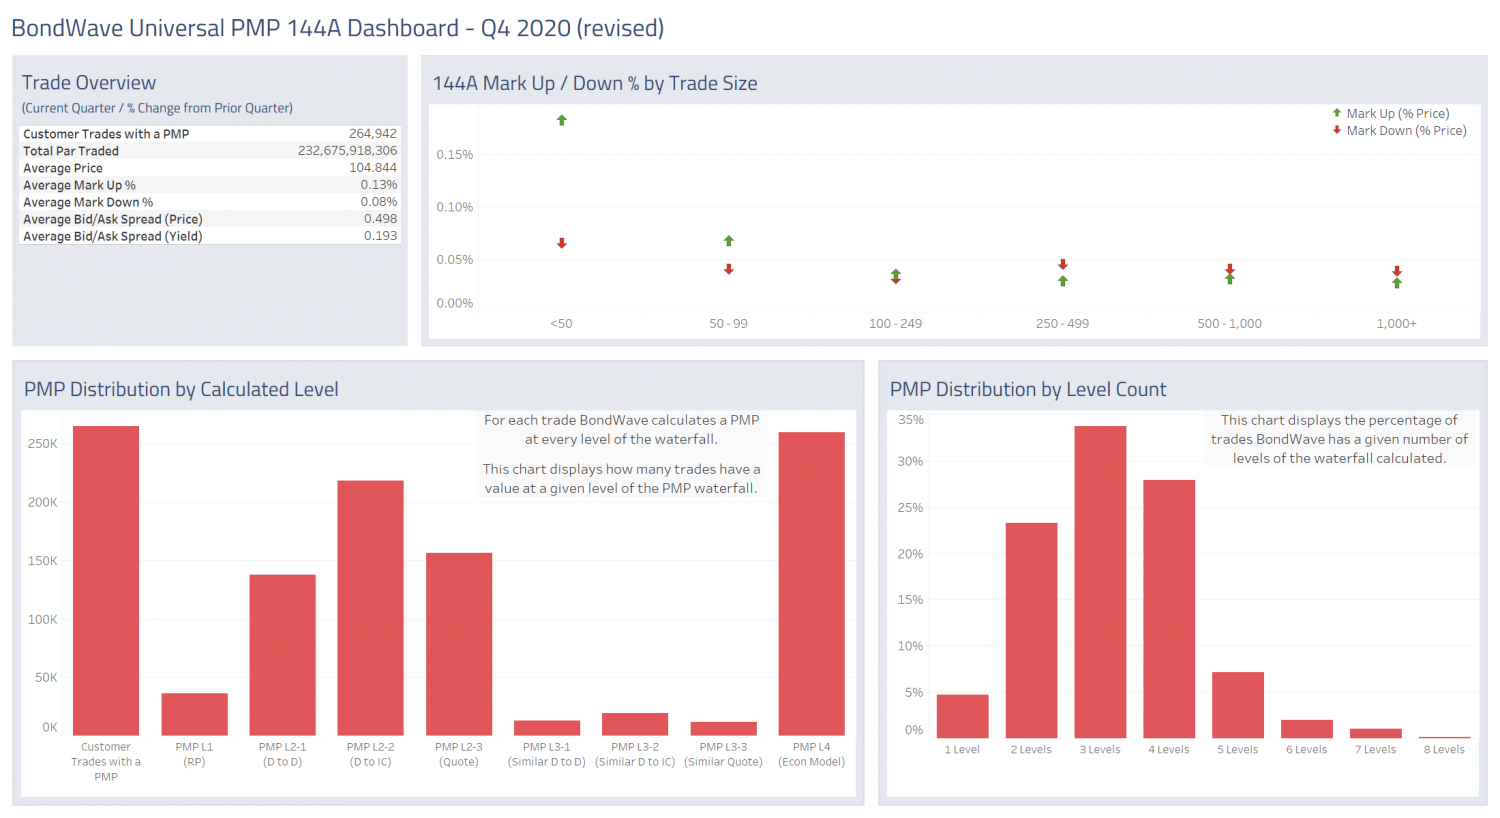
Source: BondWave BDTI
