Developed to help bond market participants better understand trading trends in the fixed income markets, BondWave’s Data Lab has released its QMarksTM dashboards for the third quarter of 2022.
Formerly known as Universal Prevailing Market Price (UPMP), QMarks is a proprietary BondWave data set that powers its quarterly dashboards to cover all disseminated bond transactions using the regulatory-prescribed Prevailing Market Price methodology for corporate, municipal, agency, and 144A. QMarks belongs to a suite of other BondWave proprietary data sets, including QCurves, QTrades, and QScores.
Q3 2022 Observations: Higher Yields Lead to Higher Trading Costs
“With yields higher, trading costs have risen across the board. See the details in BondWave’s corporate, municipal, agency, and 144A dashboards.” – Paul Daley, Managing Director
Corporate Bond Market Trends
Observations:
- In spite of rising rates, corporate volumes remain strong with the number of trades in Q3 increasing by 2.72% over Q2.
- But because of rising rates, the average trade price continues to drop, bringing notional value traded down with it.
- The average trade price for corporate bonds was 95.563 in Q2 vs. 94.373 in Q3.
- Bid/ask spreads also widened in Q3 growing from 0.135% in yield terms in Q2 to 0.144% in Q3. The spread is quoted in yield terms.
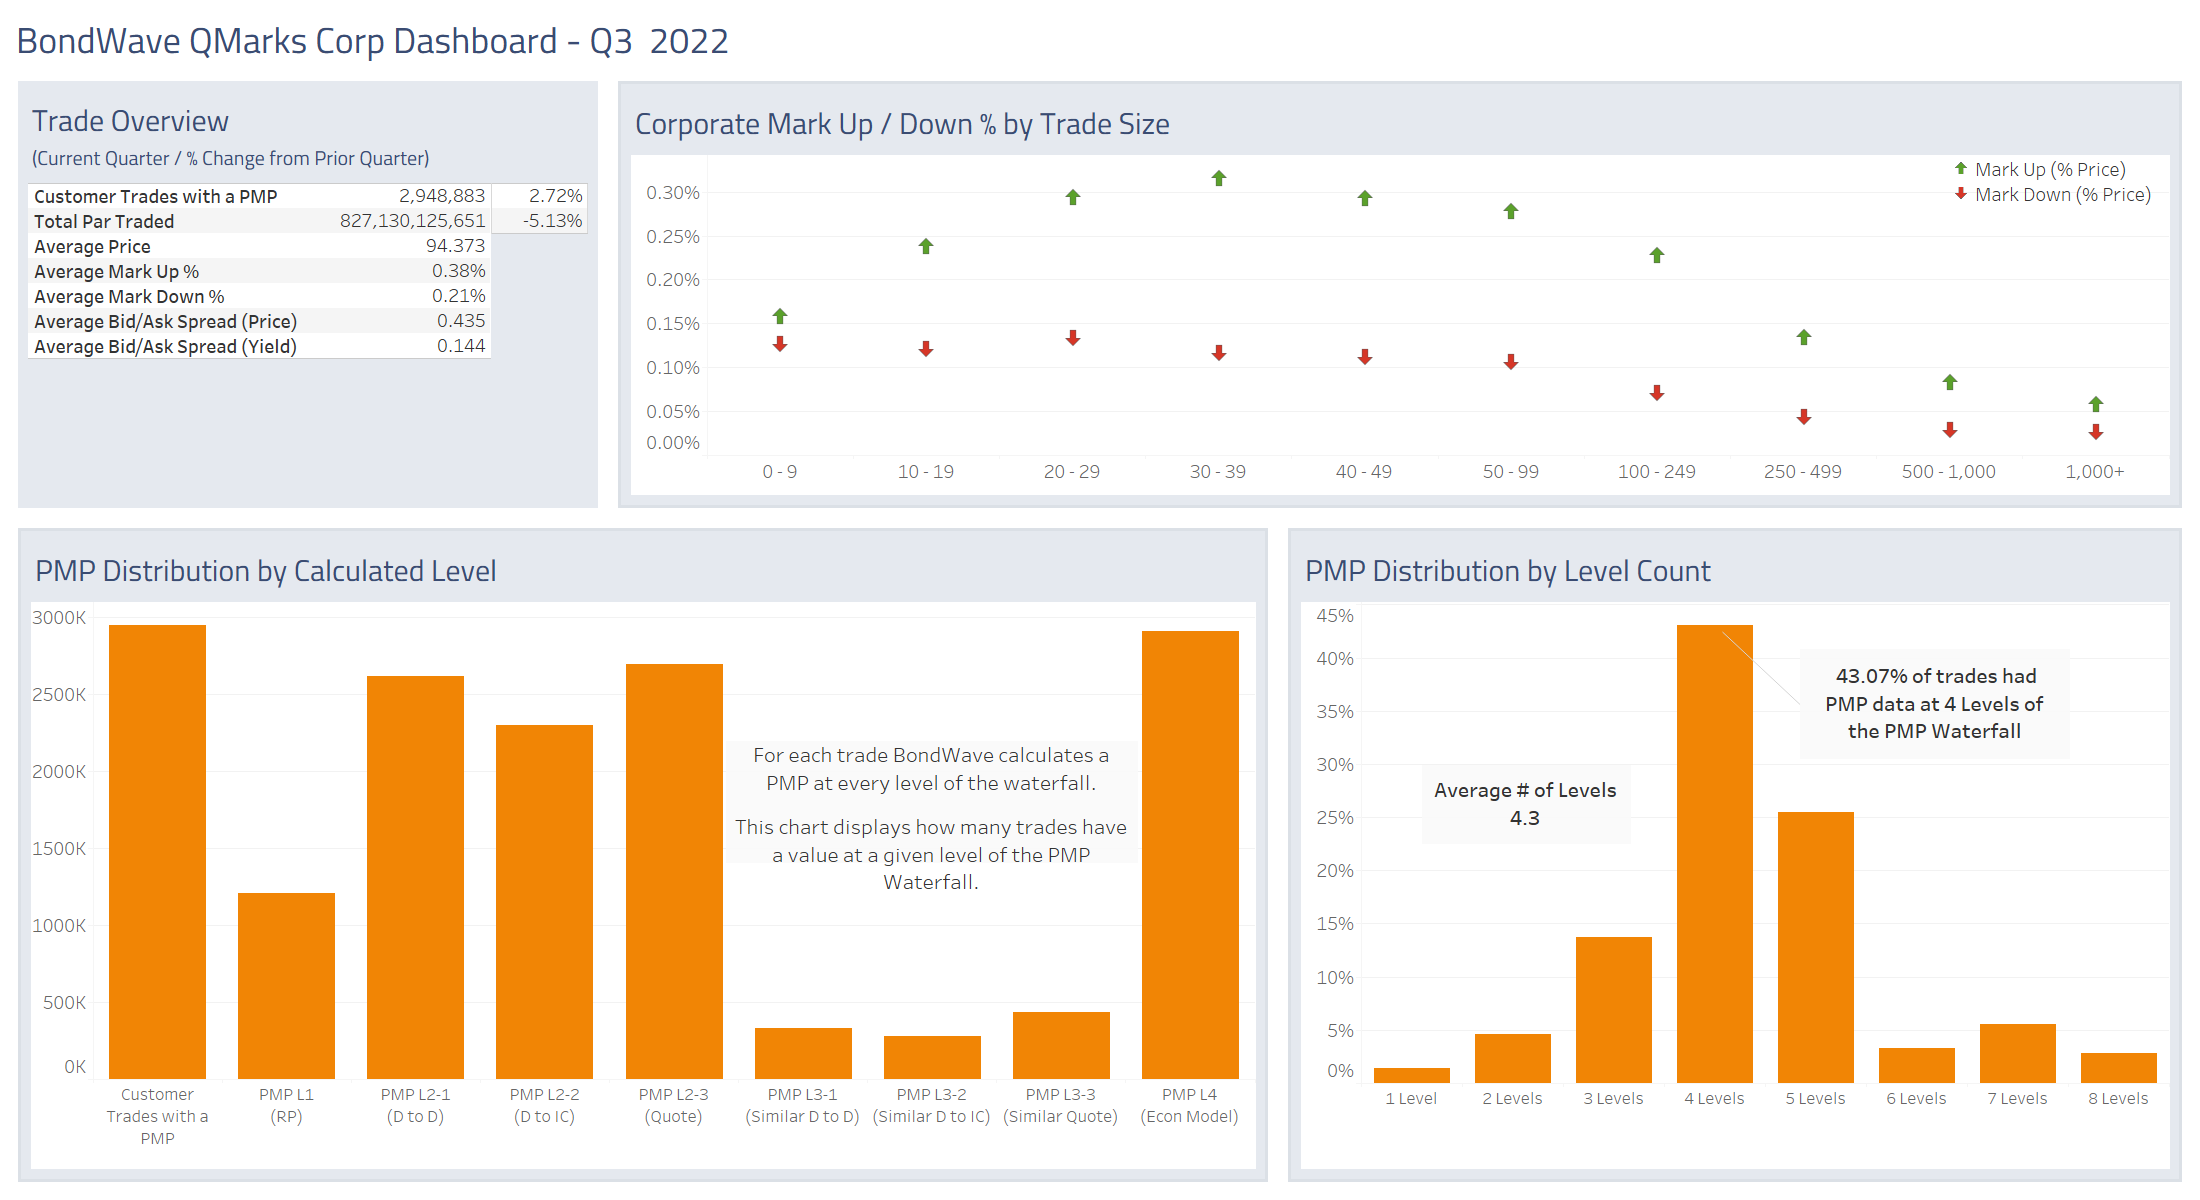
Source: BondWave QMarks
Municipal Bond Market Trends
Observations:
- In Q3 2022, municipal volume was the weakest of the asset classes we follow – down 14.67% versus the prior quarter.
- Par traded was also down 20.54% as the average price of a traded municipal bond shrunk from 103.310 in Q2 to 102.891 in Q3.
- Municipal bid/ask spreads also widened in the quarter. In Q2 the average bid/ask spread was 0.223%. This grew to 0.231% in Q3. The spread is quoted in yield terms.
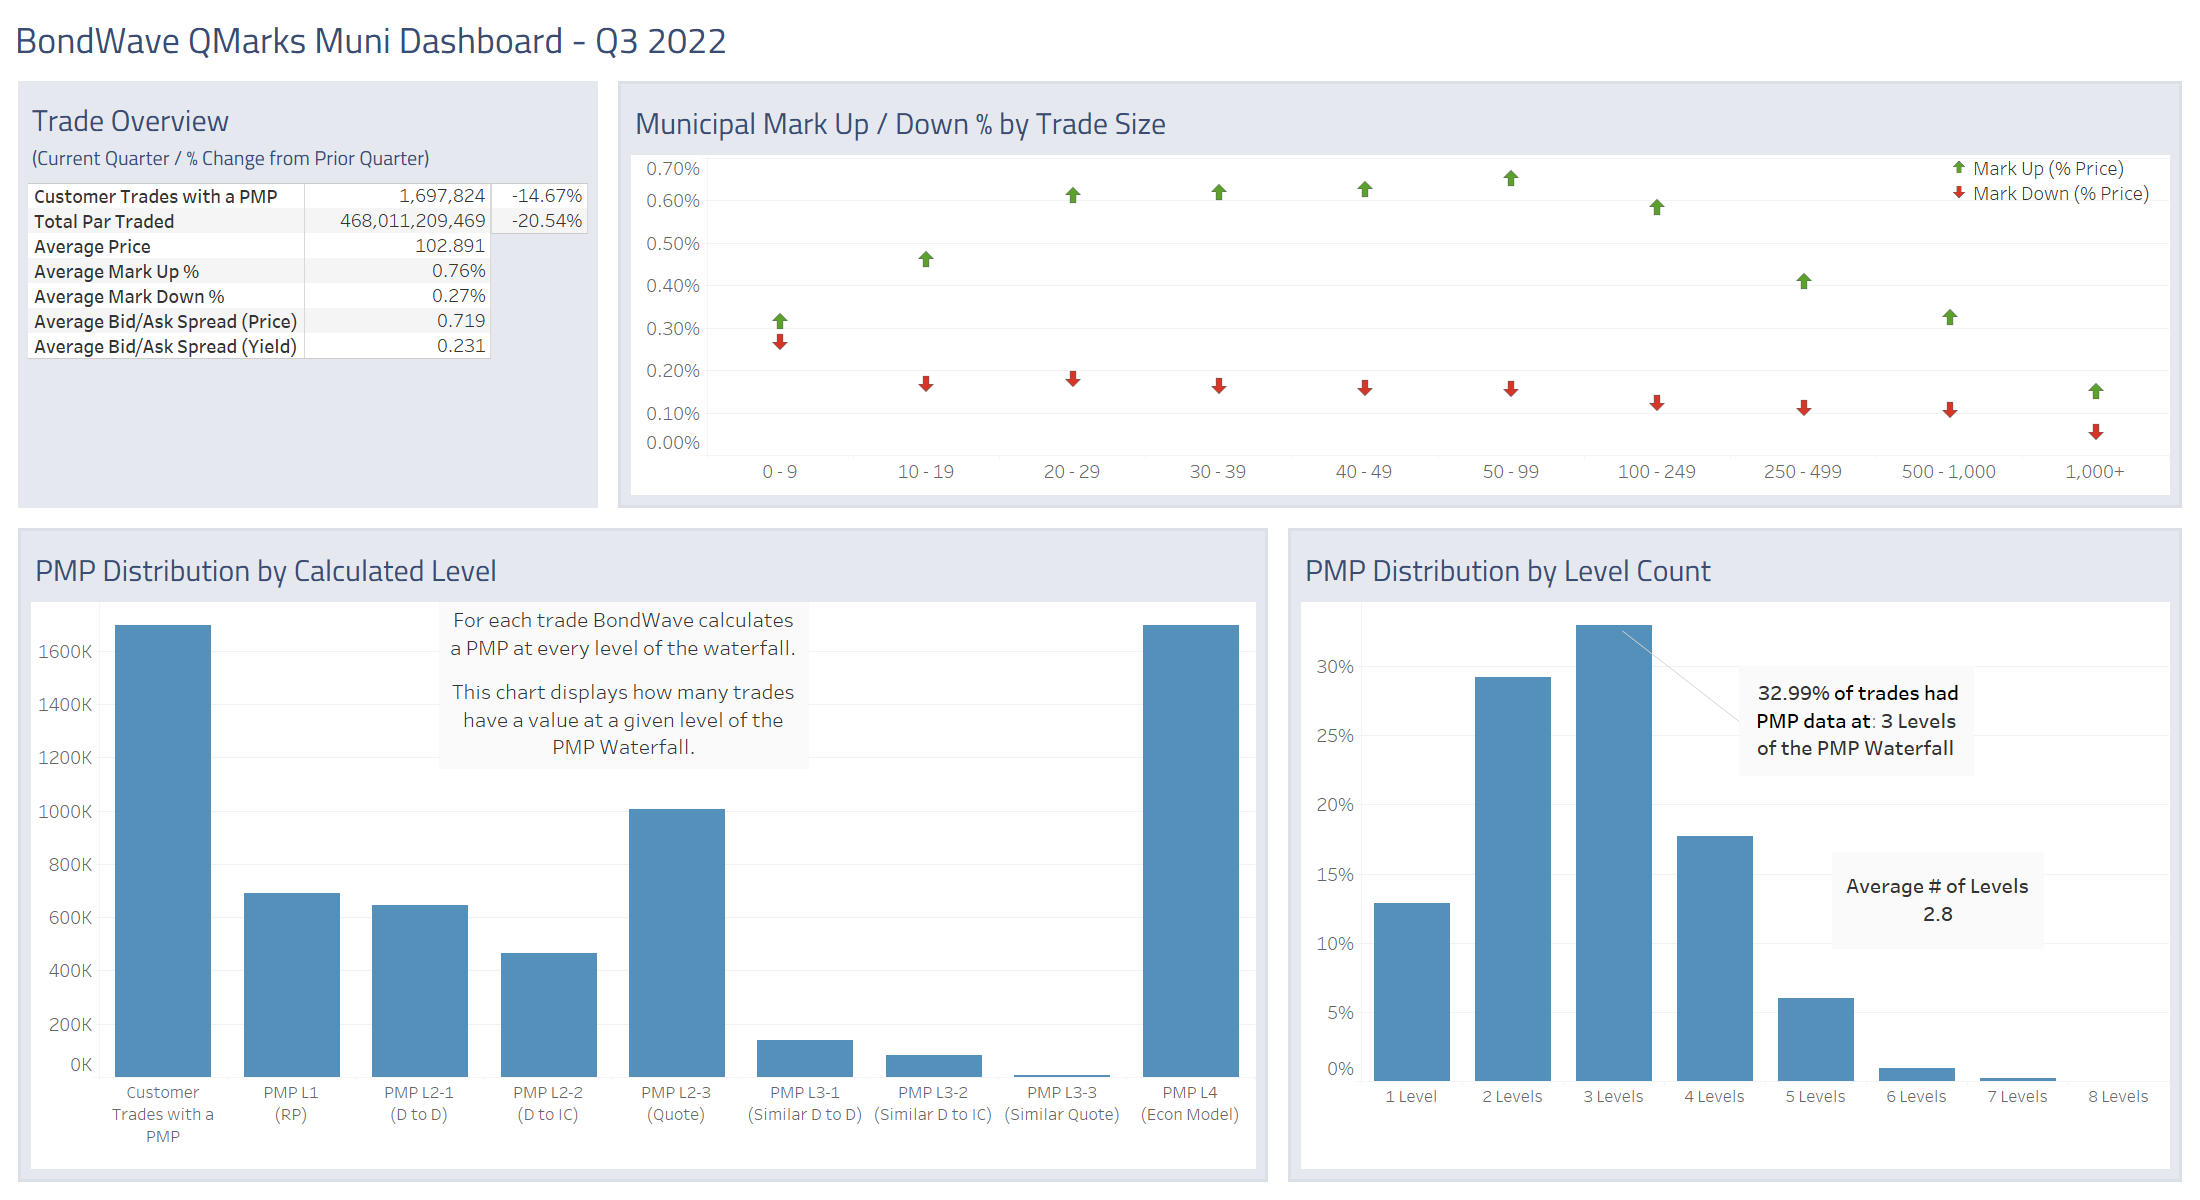
Source: BondWave QMarks
Agency Bond Market Trends
Observations:
- Agency trading volume continued its strong pace in Q3 growing 30.20% relative to Q2.
- The growth in trade counts was strong enough to ensure that par value also grew by 8.88% in spite of decreasing prices.
- The increased volume did not help to decrease bid/ask spreads, however, as they grew from 0.070% in Q2 to 0.106% in Q3. The spread is quoted in yield terms.
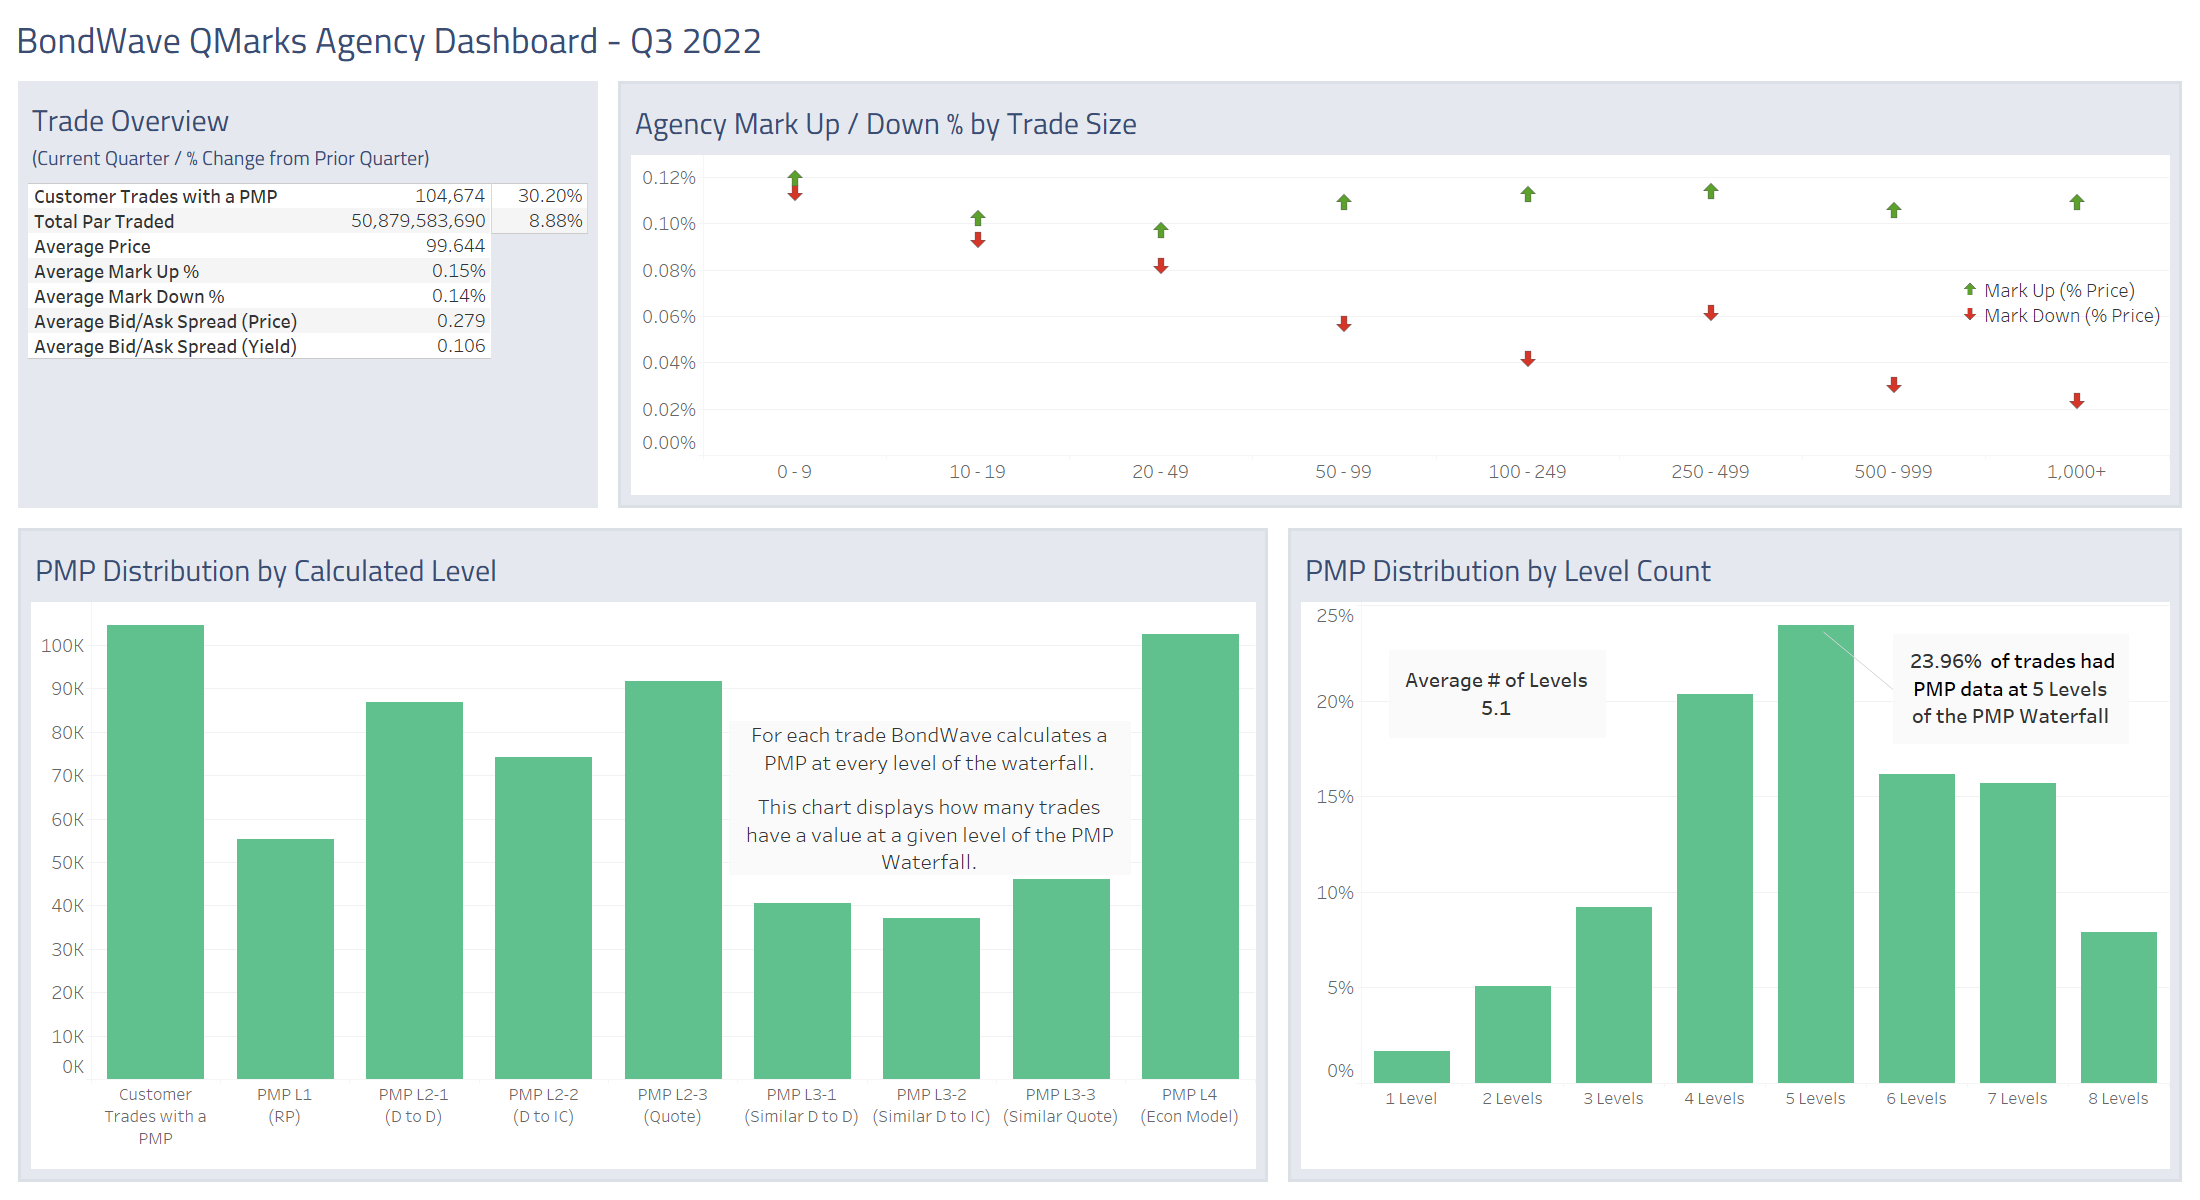
Source: BondWave QMarks
144A Bond Market Trends
Observations:
- Trading volume in 144A securities was most severely impacted by higher rates in Q3 with trade counts down 8.31% and par traded down 11.23%.
- Similar to other asset classes, 144A trading costs increased in Q3 as the bid/ask spread grew from 0.134% in Q2 to 0.146% in Q3. The spread is quoted in yield terms.
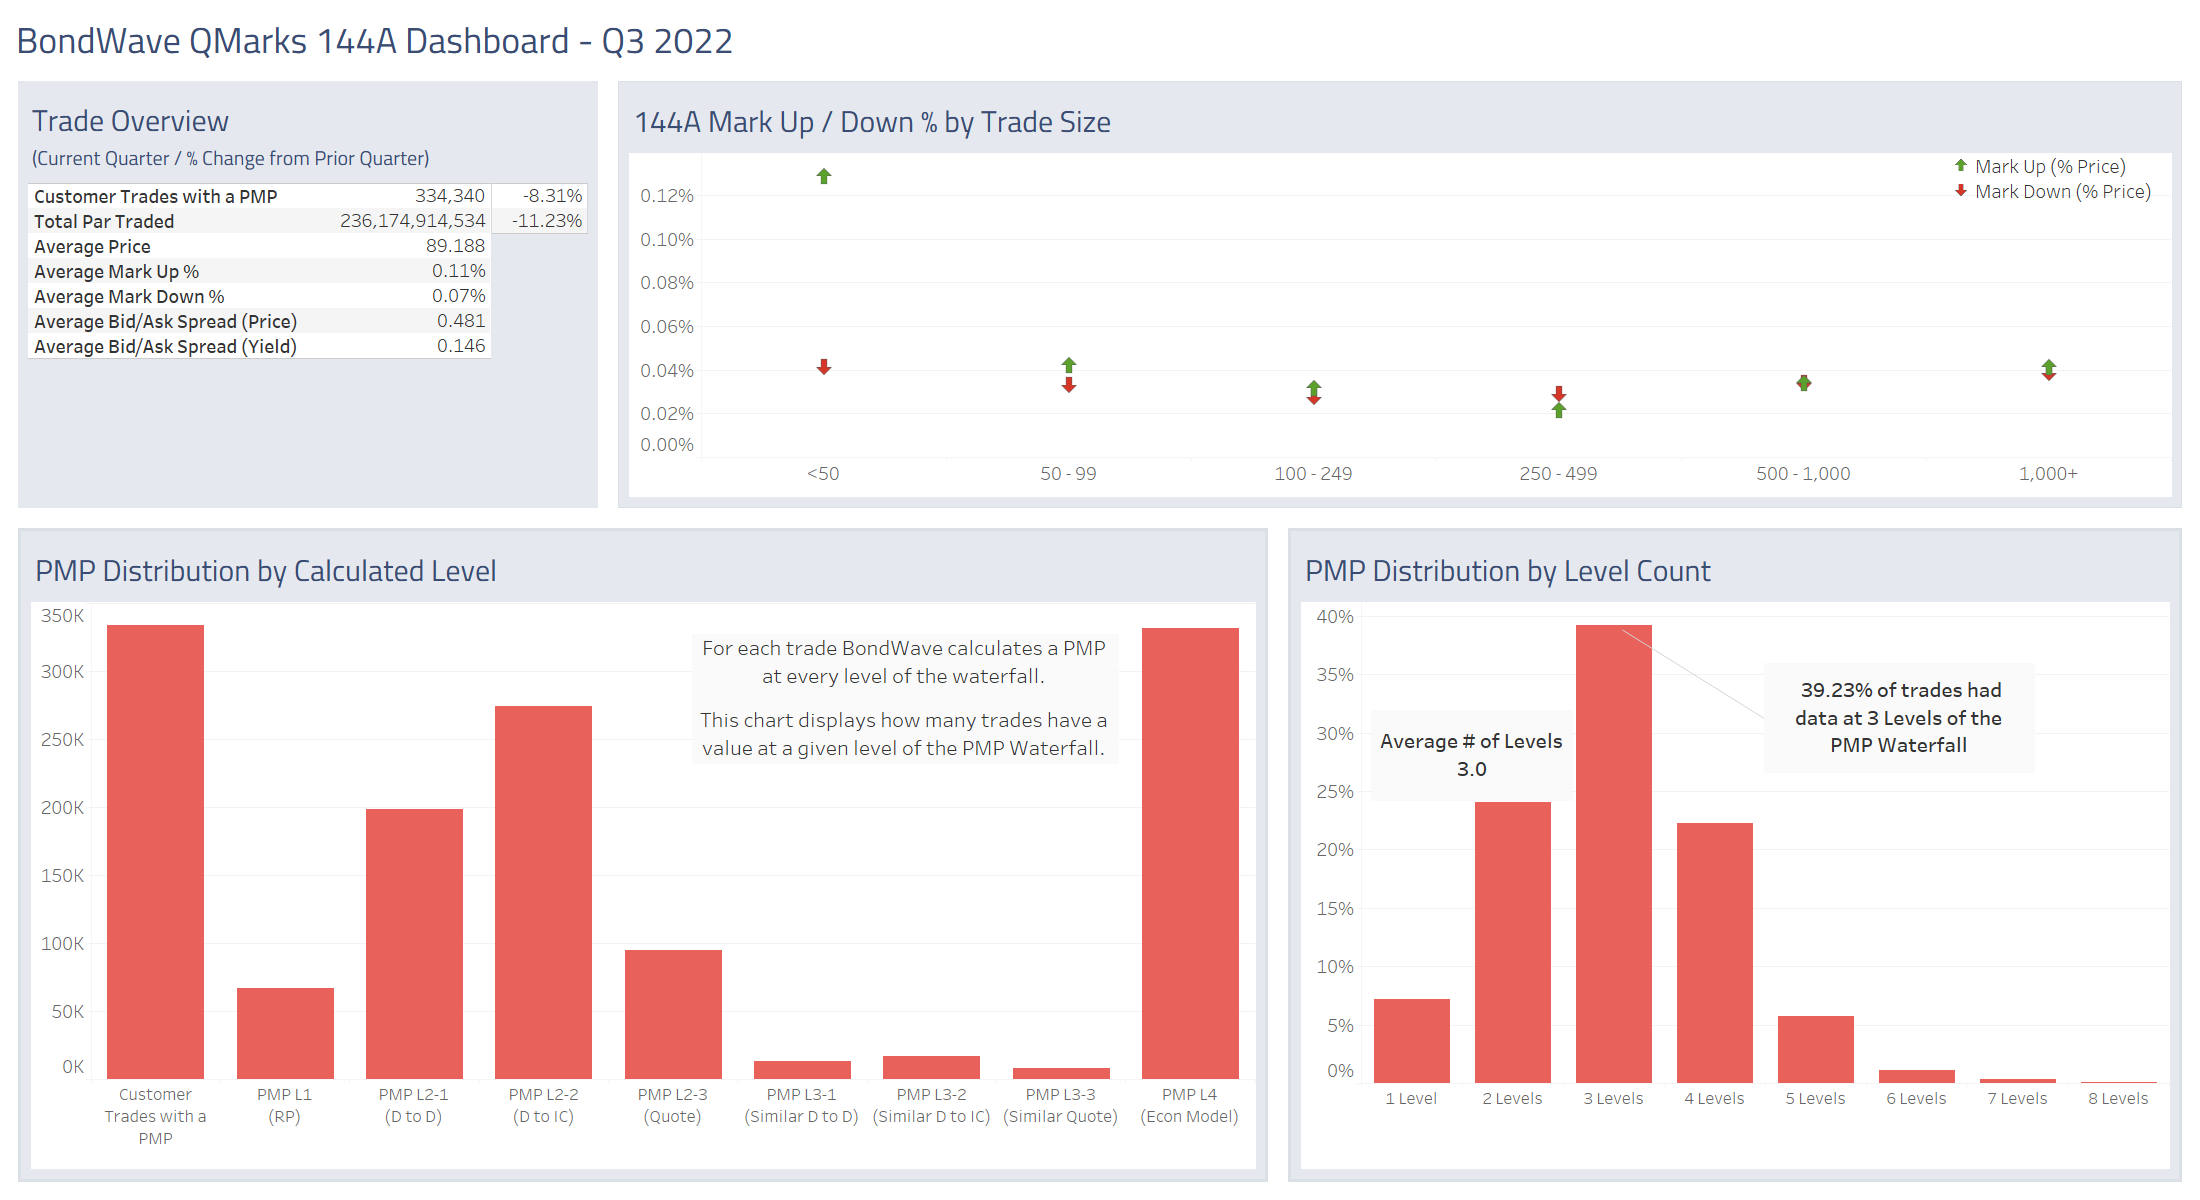
Source: BondWave QMarks
