On May 14, 2018 the Mark-Up Disclosure rule became the law of the land. For the first time brokers became required to put the amount of money they made on fixed income retail trades onto their trade confirmations. According to the FINRA’s 2016 filing for proposing this rule change, “The proposed disclosure is expected to provide retail investors with valuable pricing information, encourage investor participation in the fixed income markets, and foster price competition among dealers, which may lower transaction costs for retail transactions in fixed income securities.”1
BondWave has been measuring daily transaction costs on a post-trade basis since April 2016. Using a unique approach, BondWave has developed an algorithm that measures mark- ups and mark-downs (following industry convention we will refer to both as mark-ups except where graphing them separately) on corporate, municipal and agency bonds. Using this algorithm, we decided to take a look at the trend in retail mark-ups to determine if there has been a noticeable impact since the implementation of the disclosure rule.
What Does the Rule Require?
Again quoting from FINRA’s 2016 proposal “The proposed rule applies where the member buys (or sells) a security on a principal basis from (or to) a non-institutional customer and engages in one or more offsetting principal trades on the same trading day in the same security, where the size of the member’s offsetting principal trade(s), in the aggregate, equals or exceeds the size of the customer trade.”2 This represents the minimum disclosure required by the rule. Brokers also have the option to disclose mark-ups and mark-downs on more trades than the minimum. And some brokers are doing just that.
The information disclosed on the retail customer confirmation includes the mark-up in percentage terms and total dollars per trade. Brokers are also required to include a link to the relevant trade history for the bond, a timestamp for the retail client trade and an explanation of what the numbers mean.
The Data
Using FINRA’s BTDS (TRACE) and the MSRB’s RTRS (EMMA) databases, BondWave analyzed all trades in US corporate bonds and tax-exempt municipal bonds from Jan. 1, 2017 through Oct. 9, 2018 using a riskless principal algorithm. The goal of the algorithm is to identify trade pairs that are highly likely to be the two sides of a riskless principal trade. Dealer-to-dealer trades are matched with dealer-to-customer trades based on time, price and size. The difference between the prices of the two legs constitutes the mark-up for the trade pair. The data was then filtered to include only trades of 100 bonds or fewer to approximate retail trades.3 Table 1 shows the number of such trade combinations identified by year and product type.
Table 1
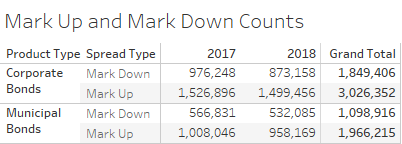
2018 through October 9
Source: TRACE, EMMA and BondWave
The Analysis
Graph 1 is a time series of rolling monthly (21 trading days) average mark-ups for US corporate bonds. All observations are equal weighted.
Graph 1
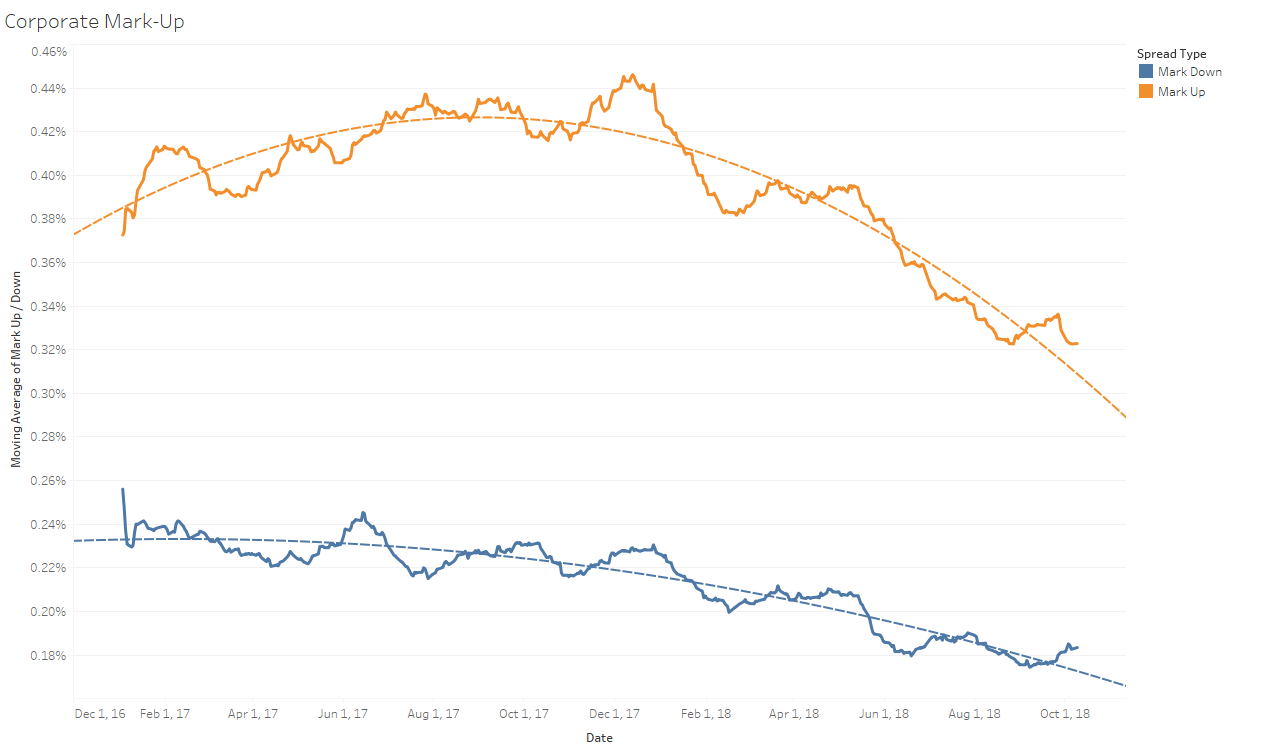
2018 through October 9
Graph 2 is a time series of rolling monthly (21 trading days) average mark-ups for tax-exempt municipal bonds. All observations are equal weighted.
Graph 2
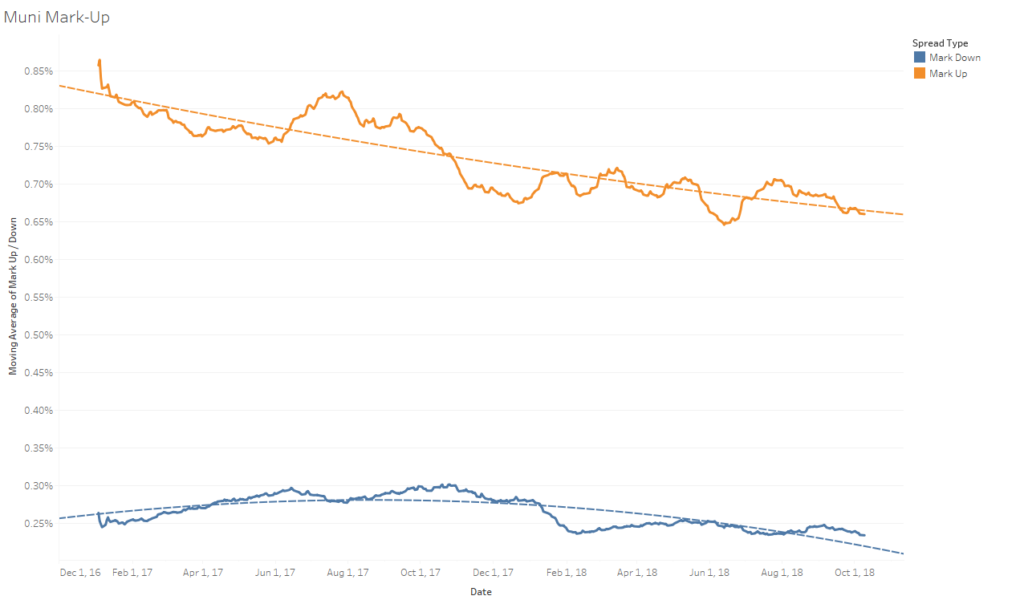
2018 through October 9
For US Corporate mark-ups and mark-downs and for Tax-Exempt Municipal bonds it is tempting to draw the conclusion that there has been a general decline in what brokers charge to retail investors to trade a bond. However, as we have seen in our research and has been demonstrated in research performed by regulators, there is a strong correlation between factors like trade size, yield, and duration and transaction costs.4 While we have already controlled for trade size in the data filter we have not yet controlled for yield or duration. Without controlling for these two variables it is possible that the apparent decline in mark-ups or mark-downs is actually due to a decrease in the duration or yield of bonds traded over time.
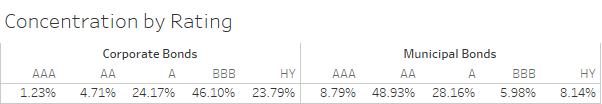
Using ratings as a proxy for yield and duration, we can normalize the data to minimize biases. Graph 3 contains US corporate bonds bucketed by duration. It is also filtered to include only bonds rated A or BBB. A and BBB rated US corporate bonds constitute 70.3% of corporate bond trades in our sample.
Graph 3
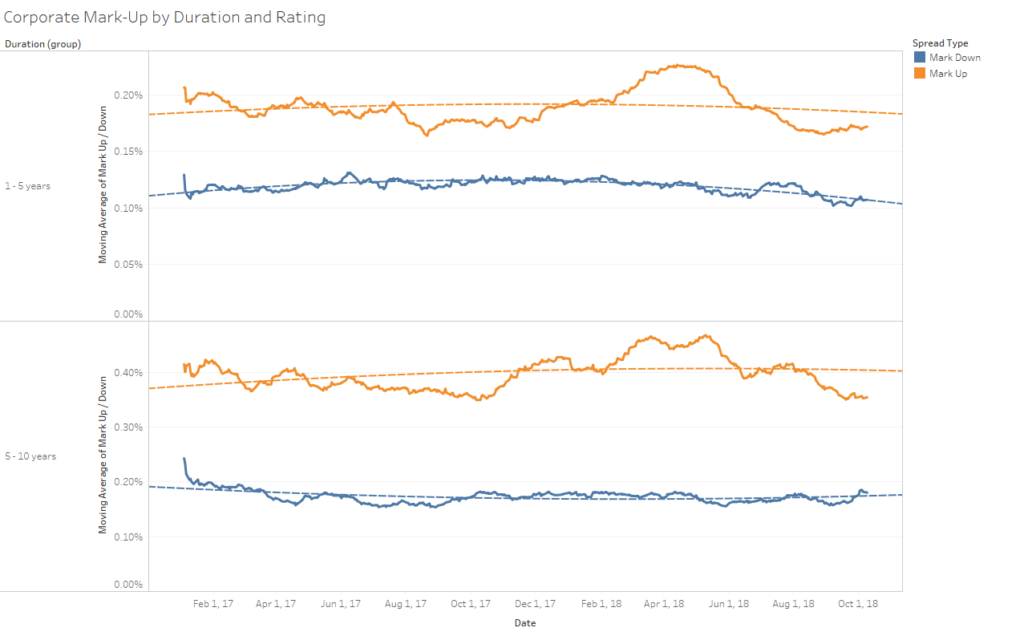
2018 through October 9
Graph 4 contains tax-exempt municipal bonds bucketed by duration. It is also filtered to include only bonds rated AA and A. AA and A rated tax-exempt municipal bonds constitute 77.1% of municipal bond trades in our sample.
Graph 4
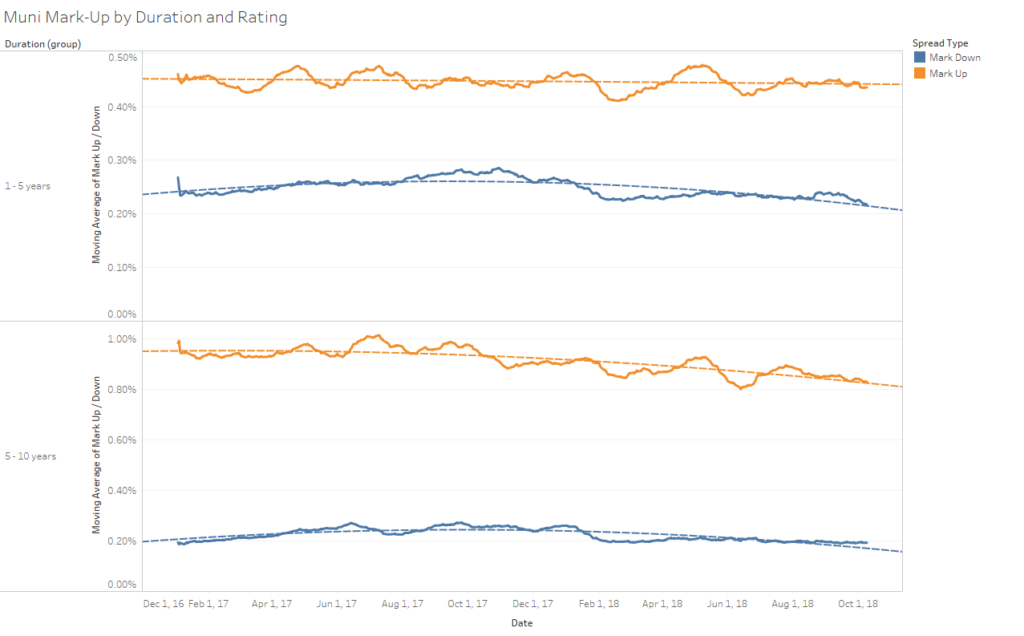
2018 through October 9
Table 2
2018 through October 9
Conclusion
We need to be careful with the conclusions we draw given the relatively short amount of time that has passed since May 14. However, early returns on the impact of the new mark-up disclosure rule are mixed. There appears to be no impact so far when retail customers sell bonds. Mark-downs are very stable over the entire time-period. It is logical that this would be the case. In the low rate environment, we have been in for the past decade there has already been downward pressure on mark-downs. With little yield left on a bond, an excessively large mark-down runs the risk of creating a negative yield on a trade. All parties prefer not to do trades that result in negative yields.
The data is less certain when customers buy bonds. There have been some ups and downs in mark-ups, but they reside in a relatively tight range and do not perfectly correlate with implementation of the rule. However, the general relationship that mark-ups are roughly twice the size of mark-downs holds in three of the four categories examined. Only in municipal bonds with durations between five and ten years do we see a significant difference in which mark-ups are several times the size of mark-downs.
1 SR-FINRA-2016-032 Proposed Rule Change Relating to FINRA Rule 2232 (Customer Confirmations) to Require Members to Disclose Additional Pricing Information on Retail Customer Confirmations Relating to Transactions in Fixed Income Securities.
2 Ibid.
3 FINRA originally defined “retail-size” as 100 or fewer bonds. Since we do not know the nature of counter-parties to reported trades we have adopted the same convention.
4 Simon Z. Wu, “Transaction Costs for Customer Trades in the Municipal Bond Market: What is Driving the Decline?” July 2018.
